Download

1 / 17
170 likes | 296 Vues
Eucoban report 2012 Erlend Hansen. New lay-out in 2012 Three former reports merged into one Steel survey continues No macroeconomic chapter from ETUI No appendix with Excel tables Improved design. Outline. Economic chapter. Main focus on: GDP growth Labour productivity

E N D
Eucoban report 2012 Erlend Hansen
New lay-out in 2012 • Three former reports merged into one • Steel survey continues • No macroeconomic chapter from ETUI • No appendix with Excel tables • Improved design
Main focus on: • GDP growth • Labour productivity • Real unit labour cost • Adjusted wage share • Employment and unemployment • Employment in manufacturing industries • Inflation (HICP)
General ideas • Linked to wage coordination rule • Limited amount of text and analyses • Tables showing 35 countries (plus EU 27/EA 17) • Both annual percentage changes and indices • Most charts cover EU 27 and EA 17 • 2012 is a year of transition • Data on web site (biannually + database) • We want feedback from you!
General ideas • Still questionnaire in Word format • Same 12 month period (May to May) • Same structure as before; demands and results • Wages, working time, pensions, equal opportunities, training, precarious work • Only most interesting information included • Present best practices • The complete replies in appendix
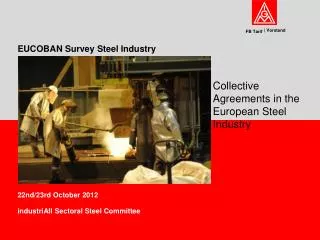
New agreements last 12 months • Metal: 15 countries • Mining, chemical and energy: 10 countries • Textile, clothing and leather: 5 countries • Steel: 10 countries • A few reports say that last year’s agreement applies to two years. • Some agreements are only local.
Unique calculation • Value Of the Whole Agreement, not total labour costs (VOWA) • Deduct inflation (HICP) and labour productivity, look at more than one year • Result: Balanced Participation in Productivity Gains (BPPG) • Is there a need for a calculation tool or a training course?
Difficult to monitor wage development • Fewer national collective agreements • Different growth during intervals, first months’ increases might stem from old agreements • Calculations to be done on annual basis • Non-wage elements. Unclear effect, sometimes with subsidies from the state. • Wage drift, positive or negative • Bonuses and lump sum increases • Precarious work, unknown salaries
VOWA figures 2012 • Metal: 9 countries, less than half of agreements fulfill coordination rule • Chemical: 3 countries, 1 fulfills rule • TCL: None • Some more might be collected due to mistake in original questionnaire.