Download
1 / 31
310 likes | 425 Vues
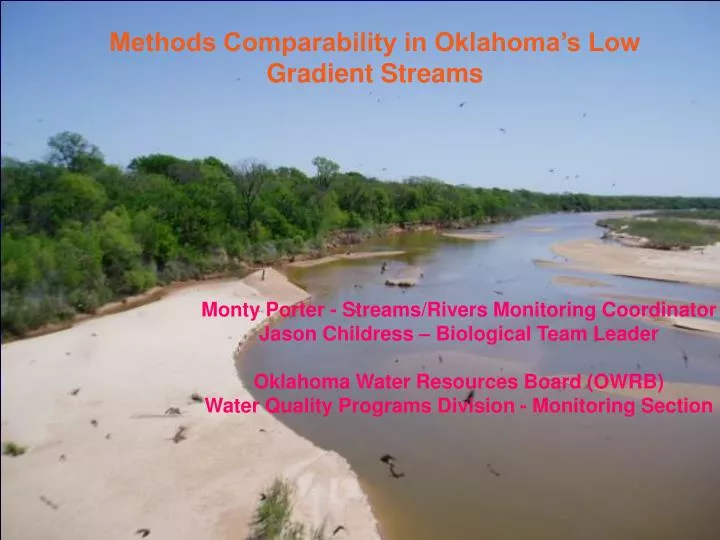
Methods Comparability in Oklahoma’s Low Gradient Streams. Monty Porter - Streams/Rivers Monitoring Coordinator Jason Childress – Biological Team Leader Oklahoma Water Resources Board (OWRB) Water Quality Programs Division - Monitoring Section. Roadmap.

E N D
Methods Comparability in Oklahoma’s Low Gradient Streams Monty Porter - Streams/Rivers Monitoring CoordinatorJason Childress – Biological Team LeaderOklahoma Water Resources Board (OWRB) Water Quality Programs Division - Monitoring Section
Roadmap • Oklahoma’s part in the National Wadeable Streams Assessment (NWSA) and Methods Comparability • What does an Oklahoma low gradient stream look like? • A look at the data and some answers—maybe?? • How can we do it better?
Questions??? • Do different sampling methods produce similar or different answers? • Can the results of different sampling methods be combined to produce a national assessment? • Is it realistic to expect states to change methods?
Oklahoma’s Part in the NWSA • Target Sites • 20 sites visited with comparability on 18 (Red River site excluded and West Buffalo Creek had sample issues) • 15 of these sites are low gradient • Reference Site Selection • 10 stations visited with comparability on 8 (Trader’s creek had sample issues) • 4 of these sites are low gradient • Station's were ecoregion-based • Used OCC reference site work and best professional judgment
NWSA Parametric Coverage • Typical in-situ parameters such as pH, dissolved oxygen, temperature, specific conductance • Nutrients • Major cations and anions • Variety of metals • Benthic Macroinvertebrates—single habitat • Periphyton • Physical Habitat • Stream Flow
Cimmaron River, Beaver County, Southwest Tablelands Ecoregion
Hybarger Creek, McClain County, Central Great Plains Ecoregion
Unknown Creek in the Arbuckle Uplift, Johnston County, Central Oklahoma/Texas Plains Ecoregion
MCS Design • Spatially consists of Fourteen WSA Cooperators • Incorporates both target and reference sites • Side-by-side collections using multiple methods (Oklahoma compared W-EMAP to State RBP)
Objectives of the MCS • Compare state to federal methods to determine the extent of the difference between the methods. • Is needed in future studies to assess the condition of the Nation’s waters. • Allays the need for standardized protocols across states • Looked at both physical habitat and benthic macroinvertebrate sampling methodologies
Oklahoma’s Benthic Macroinvertebrate Collections • Source of Method • Rapid Bioassessment Protocol adopted from Plafkin, et al (1999) • Method adopted by Oklahoma state agencies in OWRB Technical Document 99-3 (1999) • Use is codified into Oklahoma Administrative Code (OAC) through the Oklahoma Water Quality standards (OAC 785:45) and the Use Support Assessment Protocols (OAC 785:46) • Oklahoma RBP Method • Multi-habitat method targeting richest habitats in flowing water over a 400-800 meter reach • 500 uM nets and sieves are used • Composite Riffle—3 kicks in a fast, medium, and slow riffle • Streamside Vegetation—reachwide 3-minute collection of composited jabs • Woody Debris—reachwide 5-minute collection of composited scrapes/picks • 100-150 organism subsample with a large and rare scan • Identified to lowest practical taxonomic level
NWSA Methods—Benthic Macroinvertebrate Collections • Sample taken reach wide • Kick sample with modified D-frame net at 11 equidistant transects • Work L, R, C • Composite Sample • Processed at any of a number of EPA contract labs • 300-500 organism subsample • Identified to lowest taxonomic level
MCS Results • Meetings • National meeting of cooperators in Baltimore, MD • Regional meeting of cooperators in Lawrence, KS • Have results to date on only 6 states • Focused comparability on macroinvertebrates • Evaluate relationships of Indices of Biotic Integrity (IBIs) • Evaluate relationships of condition class assessment • Evaluate relationships of pass-fail assessment • Investigate effects of natural slope gradient • Investigate effects of stressor gradient • Investigate relationships with biological condition gradient
Data Analysis • Data Sets • WSA_WSA IBI—is the WSA dataset processed through the WSA IBI (Courtesy of Versar, Inc. and USEPA, OWOW) • WSA_Ok IBI—is the WSA dataset processed through the Oklahoma IBI • OK_Ok IBI—is the OK dataset processed through the Oklahoma IBI • Oklahoma IBI • Metrics are Taxa Richness, EPT Taxa Richness, EPT Abundance, Modified Hilsenhoff Biotic Index, EPT/Chironomidae Proportion, Percent Dominant Taxa, and Shannon-Weaver Diversity • 5 condition classes including Reference (Good), Non-impaired (Good), Slightly Impaired (Fair), Moderately Impaired (Poor), and Severely Impaired (Poor)
Data Analysis (continued) • Data Analysis • Evaluate relationships of Indices of Biotic Integrity (IBIs) • Evaluate relationships of condition class assessment • Evaluate relationships of pass-fail assessment • Make comparisons of IBI scores to some habitat and land use metrics • Look at some simple boxplots of data to see where some variation may exist • Data Issues • Subsample counts not standardized between datasets • Taxonomic resolution • Did not compare Oklahoma Data to NSA IBI • Sample size is small • Data collection issues including sample handling and weather • Oklahoma IBI is well used but application of reference was a first run • Do no look at biological condition gradient in this analysis Draft Interim Comparability Study. 2006. Versar, Inc. and USEPA OW
Relationships of Indices of Biotic Integrity (IBIs) • Value of r2 for Oklahoma Low Gradient Stream Data • WSA_Ok IBI vs. Ok_Ok IBI 0.20 • WSA_WSA IBI vs. WSA_Ok IBI 0.68 • WSA_WSA IBI vs. OK_Ok IBI 0.28 Draft Interim Comparability Study. 2006. Versar, Inc. and USEPA OW
Comparison of WSA_OK IBI and OK_OK IBI Scores to Various Habitat Metrics
Comparison of WSA_OK IBI and OK_OK IBI Scores to Several Land Use Metrics • RHUM0—% of human land use at the site • RAGT0—% of total agricultural land use at the site • POPDENS—population density
WSA Method/WSA IBI vs. OK Method/OK IBI Not well compared 8 of 18, or 44% have different class WSA Method/WSA IBI vs. WSA Method/OK IBI Not well compared 9 of 18, or 50% have different class WSA Method/OK IBI vs. OK Method/OK IBI Not well compared 9 of 19, or 42% have different class However, 50% of the divergence is at the Fair/Good classifications Relationship of Condition Class Assessment Draft Interim Comparability Study. 2006. Versar, Inc. and USEPA OW
Comparison of WSA_OK IBI and OK_OK IBI Condition Classifications to Various Habitat Metrics
Comparison of WSA_OK IBI and OK_OK IBI Condition Classifications to Several Land Use Metrics • RHUM0—% of human land use at the site • RAGT0—% of total agricultural land use at the site • POPDENS—population density
WSA Method/WSA IBI vs. OK Method/OK IBI Not well compared 6 of 18, or 33% have different status More sites impaired per the WSA IBI WSA Method/WSA IBI vs. WSA Method/OK IBI Not well compared 5 of 18, or 28% have different status More sites impaired per the WSA IBI WSA Method/OK IBI vs. OK Method/OK IBI Well compared 3 of 19, or 16% have different status Relationship of Pass/Fail Assessment Draft Interim Comparability Study. 2006. Versar, Inc. and USEPA OW
Answers??? • Do different sampling methods produce similar or different answers? • Can the results of different sampling methods be combined to produce a national assessment? • The r2 values between IBI scores show little to some relationship • When use different IBI’s see poor comparability between both condition classes and pass/fail designations • Using same IBI • See poor comparability at the condition class level but 50% comes at the fair/good classifications • However, when use same IBI see a little better comparability between pass/fail designations • Relationship of datasets to habitat and land use metrics is a mixed bag
Answer • Is it realistic to expect states to change methods? • No • Not economically feasible • Not politically practical • Most states have developed, adopted and revised methods that fit that state • Are following RBP’s adopted and pushed long ago by the EPA • RBP’s have been used effectively by the states to both screen waterbodies and determine impairment status of streams
So where can we go from here? • Need to invest money in comparability work • Investigate comparability at all levels from sampling techniques to metric and index development • In the end need to decide if the same final answer can be obtained • Studies need to be more tightly designed and controlled • Need to continue developing the good working relationship that came out of the national study and continues into the National Lakes Study