Download
1 / 6
60 likes | 73 Vues
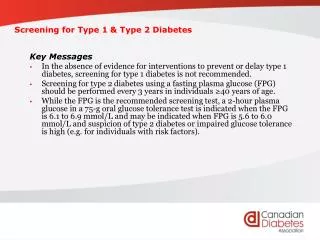
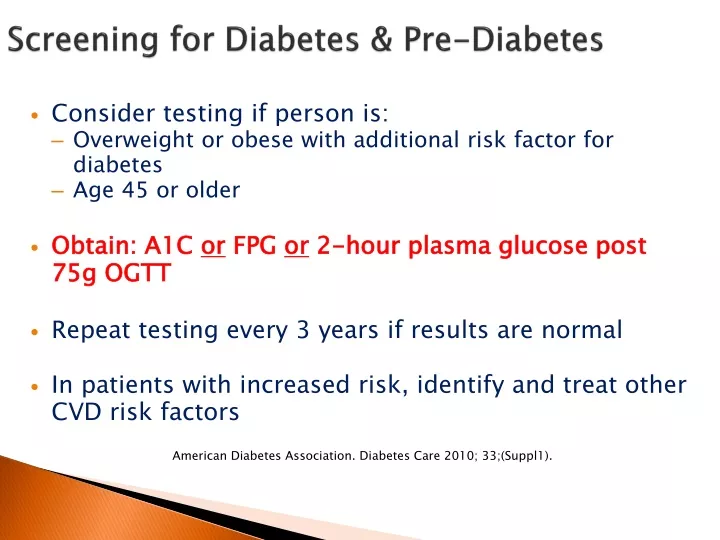
Screening for Diabetes & Pre-Diabetes. Consider testing if person is: Overweight or obese with additional risk factor for diabetes Age 45 or older Obtain: A1C or FPG or 2-hour plasma glucose post 75g OGTT Repeat testing every 3 years if results are normal

E N D
Screening for Diabetes & Pre-Diabetes • Consider testing if person is: • Overweight or obese with additional risk factor for diabetes • Age 45 or older • Obtain: A1C or FPG or 2-hour plasma glucose post 75g OGTT • Repeat testing every 3 years if results are normal • In patients with increased risk, identify and treat other CVD risk factors American Diabetes Association. Diabetes Care 2010; 33;(Suppl1).
The IRAS Study: A1C • Objective: To determine if A1C is an optimal method for diagnosing diabetes and detecting pre-diabetes compared to IFG and IGT • Results: • Detection of pre-diabetes • IFG: 69.1% • IGT: 59.5% • A1C: 23.6% • Conclusion: A1C is less sensitive for detecting pre-diabetic individuals than IFG and IGT Lorenzo et al. Diab Care. 2010 June 23. Epub ahead of print.
A1C Fasting Plasma Glucose Test (FPG) 2-Hour Oral Glucose Challenge Acceptable ≤5.6% Below 100 mg/dl Below 140 mg/dl Pre-Diabetes 5.7% - 6.4% 100-125 mg/dl (IFG) 140-199 mg/dl (IGT) Diabetes ≥ 6.5% 126 mg/dl or above 200 mg/dl or above Diagnostic Criteria for Pre-Diabetes & Diabetes American Diabetes Association. Diabetes Care 2010; 33;(Suppl.1):S11-61. .
UKPDS: 1% A1C Decrease & Reduced Risk of Complications 43% 37% 19% 16% 14% 12% Myocardial infarction† Heart failure* Stroke* Cataract extraction† Microvascular disease† Cardiovascular complications Lower-extremity amputation or fatal peripheral vascular disease† *P<0.05; †P<0.0001. Stratton IM, et al. BMJ. 2000;321(7258):405-412.
EPIC-Norfolk Study: Every 1% Increase in A1C Increased CV Risk 1% Increase in A1C Above 5% 1% Increase in A1C Above 7% Increase in Relative Risk (%)* Increase in Relative Risk (%)† 40% Men Women 30 40 28% 25% 24% 25 21% 21% 20% 30 26% 20 15 20 16% 10 10 5 0 0 *Multivariate regression – adjusted for age and risk factor; †Multivariate regression – adjusted for age, sex, and risk factor. EPIC-Norfolk: The European Prospective Investigation into Cancer in Norfolk was a prospective population study of 4,662 men and 5,570 women aged 45-79 years. Average follow-up time was 6.3 years. Khaw KT et al. Ann Intern Med. 2004;141:413-420. CHD CVD Total Mortality CHD CVD Total Mortality CHD CVD TotalMortality