Download
1 / 11
110 likes | 247 Vues
Door-to-Doc Minimum Volume Requirement Tool. Developed by: Jeffery K. Cochran, PhD Kevin T. Roche, PhD. Analysis Goals. With this tool, the user will be able to answer the question: “Is my facility’s volume sufficient to support a Split Flow process?”

E N D
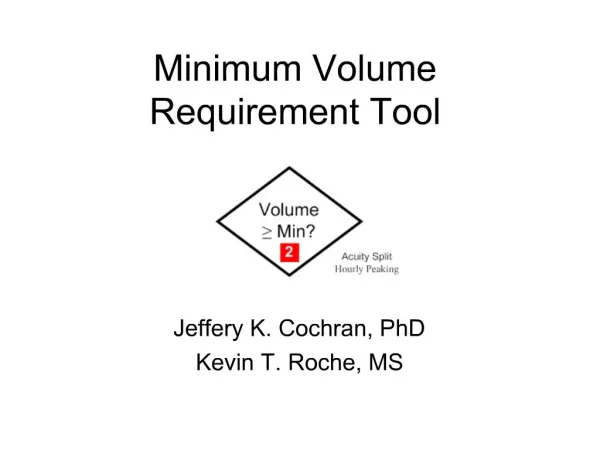
Door-to-Doc Minimum Volume Requirement Tool Developed by: Jeffery K. Cochran, PhD Kevin T. Roche, PhD
Analysis Goals • With this tool, the user will be able to answer the question: “Is my facility’s volume sufficient to support a Split Flow process?” • This decision is based on a forecasted planning volume, patient acuity mix (f1, f2, f3, f4, f5), and assumed average service times.
The Central Concept – “Two EDs in One” • After a Quick Look registration, patients travel to either the IPED or the OPED side, depending upon acuity • In the IPED, all resources come to the patient in a bed according to traditional clinical practice. • In the OPED, the patient moves among treatment areas, rarely in front of a doctor, for example, not while awaiting test results or during hydration. • Patient splitting is based on an ESI-like acuity scale where Level 1 and 2 patients go directly to the IPED and Level 3, 4, and 5 patients are initially routed to the OPED. • Some Patients will be ‘upgraded’ from OPED to IPED. • The next slide shows the OPED and IPED Split ED areas graphically.
rOW = (f3+f4) / (f3+f4+f5) rOI = 20% Intake/ Discharge IPED Results Waiting rWO = 100% rRI = f1+f2 The OPED rRO = f3+f4+f5 Quick Look LWOT 0% Tool 2 Question:Is there enough patient volume here to support a separate service? Ambulance Diversion Patients Splitting Patient Flow • Here rIJ is the fraction of patients who flow from area I to area J. Recall that patient acuity mix is defined as (f1, f2, f3, f4, f5) and used for the initial split. • Patients of acuity 5 visit only the OPED Intake/Discharge area. Patients of acuity 3 and 4 visit Results Waiting and Intake/Discharge (on the way in and out). • From clinical experience, typically 20% of OPED patients are ‘upgraded’ to IPED.
Tool Inputs f1, f2: Patients initially routed to IPED • Yearly Planning Volume • This number can be current or future forecasted volume. • Hourly volume during the peak period will be determined from this. • Patient Acuity Mix • These numbers determine the routing of patients to IPED and OPED. f3, f4, f5: Patients initially routed to IPED Intake/Discharge
Adjusting for Daily Peaking[1][2][1] and [2] are references confirming our time of day peaking study below. • ED arrival volume patterns (not overall levels) are predictable by hour of the day. For example: • Volume is stable during the 9 am-9 pm peak at a multiplier (compared to average daily volume) = 1.30
Calculating Tool Output • Hourly ED Arrivals: • The number of patients per hour arriving to the ED during the peak 12 hours • Arrivals/Hr to Intake/Discharge: • All lower acuity patients are either discharged after Intake or upgraded to be transferred to the IPED. Lower acuity patients see a doctor in this area twice.
Minimum Volume Requirement ToolDouble click on the spreadsheet below and replace the data with your ED’s information.
Understanding Tool Results • An average hourly Intake/Discharge volume of > 4.05 patients will support a single doctor at 70% utilization during the peak hours which provides good door-to-doc times. • If your results cell is green, at least one provider is required on the OPED side. • If the results cell is red, implementing split flow is more complicated. Although there is not enough business to keep the area fully busy, the principle of ‘patients do not own a bed’ can still be used and lower acuity patients may wait for results or be hydrated in waiting spaces rather than full service IPED beds.
Next Steps • The results of this tool are purely for you and your organization’s information. • If you are interested in attending a training session, please feel free to complete the letter of intent form and return it to Chris Hund at chund@aha.org by 4/28/10 regardless of your results. • Training locations will be based on area interest.
References [1] Green LV, Soares J, Giglio JF, Green RA. Using queueing theory to increase the effectiveness of emergency department provider staffing. Academic Emergency Medicine 2006;13:61-68. [2] HealthTech Briefing Report. Key trends in emergency and trauma services. Health Technology Center Oct 2006. http://www.healthtechcenter.org/.