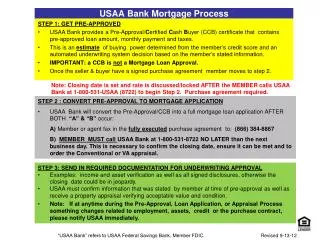
Download
1 / 30
390 likes | 584 Vues
USAA Wellness. Investing In Employees and Building the Wellness Culture. Peter Wald MD, M.P.H. Vice President, Enterprise Medical Director. July 2014. 2006 C. Everett Koop National Health Award-sole winner

E N D
USAA Wellness Investing In Employees and Building the Wellness Culture • Peter Wald MD, M.P.H • Vice President, Enterprise Medical Director • July 2014
2006 C. Everett Koop National Health Award-sole winner Comprehensive, multi-discipline, and integrated health & productivity management program (http://www.sph.emory.edu/healthproject) Multiple local Wellness awards 2005-2014 (Healthiest Employer, SA Healthy Worksite Recognition, Local Chambers of Commerce, etc) Diversified financial services company The leading provider of competitively priced financial planning, insurance, investments, and banking products to members of the U.S. military and their families. 10+ million members rely on the convenience and accessibility of USAA financial products backed by industry-leading service. Business Week #1 Customer Service 2007 and 2008 Business Week #2 Customer Service 2009 and 2010 USAA Employees are the “secret sauce” of our competitive advantage
Wellness Strategy How we do it Measures and Successes Future Directions- Internal and External Menu-Wellness Journey and Strategy
We want to maximize health and quality of life for employees and their families so we can better serve our members. We are “investing” in our employees and building a wellness “culture” for the long term. Culture is what employees “hear” and what they “see” Wellness is tightly integrated with routine Medical and Retirement Benefits We are actively creating and supporting behavior change. Our focus is employee productivity Keeping employees healthy through primary prevention (Wellness) Management commitment is the single most important factor for success. We monitor program efficacy What-Wellness and our Benefits Strategy Executive management briefed before implementation that there is a 3-5 year delay for financial returns.
Sick At-Risk Well Balance Health Wealth How-Targeting employee risk groups Three domains: Physical, Financial and Emotional Health
Wellness Messages • Don’t Smoke • Be Active • Eat Right • Prevention “Brand” strategy. Always on message, but always simple
Wellness Clinical services Integrated disability management Wellness programs. Data warehouse Wellness Partners Safety Fitness and Recreation Food services Communications Company store Corporate Real Estate Strategic Wellness Model • Multiple Outsourced Vendors • USAA is the integrator. • Assembled “Best of Breed” program • Individually selected by RFP process. • Completely internal selection process
Identity/Brand Health Risk Assessments Health Promotion Tools and Interventions Financial Incentives On-site Services and the “Built Environment” Healthy Food Services Population Data Analysis-Total Cost & Employee Trends Key Program Elements Building the “Wellness Culture.”
Specific Examples • Population • Preventive benefits ($300/y) • Wellness benefits ($350/y) • Smoking Cessation and Weight Management • HRAs and biometrics • On-site fitness rebate (25/50/75%) • “Healthy Points” • Wellness breaks • Recreation and nontraditional fitness • Calorie balance tool • Workplace safety (Be Safe) • Healthy food services (The 4 P’s) • Tobacco-free campus • Targeted • Individual Health Management • BMI Reduction • Integrated disability mgmt • Transitional duty • Ergonomics Assessments Intervening
Healthy employees use less resources 85% of employees use 20% of resources 12.5% of employees use 40% of resources 2.5% of employees use 40% of resources 50-80*% of total costs are related to behaviors associated with preventable diseases Smoking Physical Inactivity Poor nutrition/obesity Inattention to preventive practices Snapshot-USAA population health summary (2013) Indicators for high risk conditions. Glucose >100 7.2% Cholesterol>240 6.2% Cholesterol>200 29.5% Blood pressure>120/80 24.2% BMI >25 68.3% BMI >30 34.2% *Modifiable Behavioral Factors as Causes of Death JAMA. 2004
Satisfaction Participation Risk factor reduction Economic impact Measures- Sustaining Management Commitment to Wellness Short-term gains in productivity and disability sustain management commitment to longer-term gains that result from healthier employees.
Context: HRA Participation * Represents two campaigns: Sept 03 and Feb 04 ** No incentives offered *** Fitness Equipment incentive ended 12/31/09 Participation increases employee awareness and ability to respond to risks.
Context: Successful Healthy Points Participation 34.8% of population 31.7% of population 28.1% of population
2009-13 Trends - Health Risk Assessments and Body Mass Index-Updated Trend is moving in the right direction BMI 3.7% Reduction Average BMI (‘09 to ‘13) 24% Reduction Average Risk Factors -11% -19% Percent ofParticipants 2013 HRA 2009 HRA T1 = First HRA T2 = Last HRA
Bending the cost curve… Employee 2.0% annual increase Dependent 2.4% annual increase Dep (Adjusted) 2.8% annual increase • Background • Full replacement CDHP • Same health plan for both groups • No Wellness services delivered to dependents vs. full suite of services to employees Comprehensive wellness services flatten cost curve for this large employee population Adjusted for Inflation
Controlling Lost time… STD 1.1% Annual Decrease LTD/WC WC 37.2% Annual Decrease (Through 2013 Q3) LTD 12.3% Annual Decrease STD • Background • Transition Duty, medical case management and safety interventions. • Work and non-work related disability managed in same system Integrated Disability Management services reduce all disability lost time
Working Closely to Deliver Primary Prevention for Injury Reduction Ergonomics Evaluation Totals by Location 5169 total ergo evaluations from Jan. 1-Jun 18, 2013 Short url on Connect: go\ergo Targeted interventions for RMI’s and Slips, Trips and Falls - Leveraging the Wellness Culture
Integrated Disability Management for 2012 • Better management of cases • $6.38M returned to business • Transitional Duty • 441 completed • Physical Demand Job Audits • 283 jobs covering 83% of employees • Standardized and ready to go • Job Adjustments • 506 completed At Work, Focused and Productive
Context: Turnover The retention rate for employees who receive a rebate (at least 50 visits in a single year) is higher than retention for both member contact and non-member contact employees
Context: “Built Environment” Communication Solutions • What messages do the physical environment send? Are they all aligned? • Create a “surround sound” environment of Wellness messages • Foster wellness communities • Include fiscal and emotional wellness • Provide financial incentives
Context: BMI is a Leading Indicator of Health Risk • Assumptions: • 2013 dollars and employee count Individuals with BMI ≥ 30 have a higher prevalence of acute health conditions
Focus-We Need to Move Employees and Their Families to Healthy BMI. 10% weight loss annually Employee begins BMI: 35 End of 1st yearBMI: 31.5 End of 2nd yearBMI: 28.4 End of 3rd yearBMI: 25.5!! Reducing weight by 10% annually dramatically improves BMI
Employee completes HRA Healthy Points Valuable reward options ALL Earn points throughout year to receive valuable reward Activity (examples) • Premium discount ($300/600/900) • Use at open enrollment • Complete spouse/dependent online HRA • Complete onsite biometric screening • Participate in Healthy Challenges • Increase physical activity • Eat more fruits and vegetables BMI > 27 • Participant in Community physical activity events BMI > 27 Reduce weight by 10% or reach BMI of 27, $250 ALL $350 for Weight Management, Smoking Cessation Wellness 2.0-Encouraging healthy behaviors Incentives effective for behavior change but not for long term maintenance.
Wellness 2.0- Healthy Points Moving from participation to results.
Wellness 3.0- The Road Ahead… • Corporate Healthy Points • Incremental incentive for overall population health improvement • Must meet individual Healthy Point goal to be eligible • Unhealthy behaviors by individuals effects health costs for everyone • Fitness Everywhere • Gateway for physical activity for 60% of employees who are not fitness members • Evolution from fitness center centric to activity where YOU are • Create and reinforce a Be Active culture • Invest in Food • “Eat This, Not That” pricing model • Create and reinforce an Eat Right culture • Community Based Interventions BMI is our primary intervention target Shared destiny and shared responsibility.
External Strategy-New Employees drive up Population BMI • Community BMI growth is +0.2-0.3/yr, while USAA BMI growth over the past 3 years is -0.06 • Entering employees have higher age adjusted BMI than existing employees Age Adjusted BMI of Employees* *.25 BMI increase/yr We need to engage the community to avoid diluting our internal success.
Project ResultsImprove Community Health in USAA Operating Cities • Improve Community Health through Wellness in our schools • Replicate our internal strategy in the community • Position USAA as a community leader • Leverage our expertise to assist Community institutions • Mayor’s Fitness Council (www.fitcitysa.com), San Antonio Business Group on Health, San Antonio Medical Foundation Healthier dependents, retirees and new hires return savings to the Enterprise
Keep employees and their families healthy Executive management support is critical for success. Program metrics are critical to allow them to stay engaged Management has to be comfortable seeing the overall return of all the integration working together, not individual component parts Internal Medical expertise adds opinion diversity and value Requires a long term vision, and internal and external Wellness strategy Investing in our Populations Tight integration improves value