Download
1 / 22
220 likes | 323 Vues
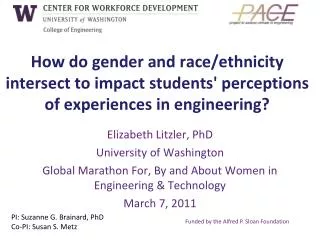
Gender and Race/Ethnicity in Engineering: Preliminary Findings from the Project to Assess Climate in Engineering (PACE). Elizabeth Litzler, PhD University of Washington ASEE Session 3592, June 23, 2010. PI: Suzanne G. Brainard, PhD Co-PI: Susan S. Metz RA: Stephanie Jaros. Objectives.

E N D
Gender and Race/Ethnicity in Engineering:Preliminary Findings from the Project to Assess Climate in Engineering (PACE) Elizabeth Litzler, PhD University of Washington ASEE Session 3592, June 23, 2010 PI: Suzanne G. Brainard, PhD Co-PI: Susan S. Metz RA: Stephanie Jaros Funded by the Alfred P. Sloan Foundation
Objectives • How do gender and race/ethnicity intersect to impact students’ perceptions of experiences in engineering? • Introduce PACE • Quick overview of methodology • Findings Funded by the Alfred P. Sloan Foundation
Importance • Little on gender & race in engineering • Research & theory tells us that it matters (Hooks 1981, Spelman 1988) • Disaggregation by gender and race/ethnicity is often difficult for engineering disciplines—PACE data makes it possible. Funded by the Alfred P. Sloan Foundation
PACE Goals • Improve retention among engineering undergraduates • Action steps to achieve this goal: • Data, Benchmarking, Recommendations, Follow-ups • 22 Schools • Funded by Alfred P. Sloan Foundation Funded by the Alfred P. Sloan Foundation
PACE Schools • Arizona State University • Boston University • California State University-L.A. • Clemson University • Howard University • Michigan Tech • New Jersey Institute of Technology • New Mexico State University • North Carolina State University • The Ohio State University • Penn State • Purdue University • Renssalear Polytechnic Institute • Rose-Hulman • Texas A&M • Texas Tech • University of Maryland • University of Michigan • University of Texas at Austin • University of Texas at El Paso • Virginia Tech • Worcester Polytechnic Institute Funded by the Alfred P. Sloan Foundation
PACE Schools Funded by the Alfred P. Sloan Foundation
PACE Mixed-Mode Method Online Survey On-site Interviews Current and former engineering students: 179 interviews completed at 16 schools, 124 current students and 55 former students • Current engineering students • Oversampled under-represented groups • > 10,000 completions (28%) Funded by the Alfred P. Sloan Foundation
Survey Respondent Demographics Funded by the Alfred P. Sloan Foundation
School Representation • African American survey respondents • No one school >13 percent • Every school contributes • Hispanic American Survey Respondents • One school = 22 percent • Two schools combined contribute 28 percent • All other schools contribute Funded by the Alfred P. Sloan Foundation
Focus of Analyses • Differences and similarities in four main areas: • Professor-Student Interaction • Student-Student Interaction • Confidence • Risk of Attrition Funded by the Alfred P. Sloan Foundation
Analysis Methods • 2 x 2 Contingency Tables • 5 point scales reduced to binary variables • Chi-Square: Are two variables associated? • Adjusted Residuals: Where is the association? • Values > |2| • Odds Ratios: How strong is the association? • OR=1=no effect, OR>1=increase in odds, OR<1=decrease in odds Funded by the Alfred P. Sloan Foundation
Professor-Student Interaction Never, Rarely, Sometimes=1 and Usually, All the Time=2 • Do your professors inspire you to study engineering? • Are you comfortable asking questions in class? • Do your professors care whether or not you learn the course material? Funded by the Alfred P. Sloan Foundation
Professor-Student Interaction Funded by the Alfred P. Sloan Foundation
Student-Student Interaction Never, Rarely, Sometimes=1 and Usually, All the Time=2 • Do you feel like part of an engineering community? • Do other students take your comments/suggestions in class seriously? • Do students compete with each other in classes? • Do engr. students help each other succeed in class? Funded by the Alfred P. Sloan Foundation
Confidence Strongly Disagree, Somewhat Disagree=1, and Somewhat Agree, Strongly Agree=2 • I am confident in my ability to succeed in my college engineering courses Funded by the Alfred P. Sloan Foundation
Confidence Funded by the Alfred P. Sloan Foundation
Risk of Attrition Strongly Disagree, Somewhat Disagree=1, and Somewhat Agree, Strongly Agree=2 • I have no desire to declare a non-engineering major (e.g. biology, theater, English, philosophy) • I can think of other majors that I would like better than engineering Funded by the Alfred P. Sloan Foundation
Risk of Attrition Funded by the Alfred P. Sloan Foundation
Take Away • Student experiences are diverse at the intersection of race/ethnicity and gender • Race and inspiration • More race differences among females (Interaction) • No gender differences among African Americans • Females less comfortable, confident, more risk of attrition than males (Whites and Hispanics) • Disaggregate whenever possible • Look for interaction effects Funded by the Alfred P. Sloan Foundation
Thank you! Questions? Funded by the Alfred P. Sloan Foundation
Respondent Representativeness Positive percentages indicate group is overrepresented among respondents while negative percentages indicate group is underrepresented among respondents. Funded by the Alfred P. Sloan Foundation