Download
1 / 12
120 likes | 232 Vues
WorkSafeBC Statistics 2009. Mental Health Info Session September 20, 2010. This report is available online at www.worksafebc.com. Key Statistics (2009). Key Statistics (2009). Reported Fatalities & All Reported Injuries.

E N D
WorkSafeBC Statistics 2009 Mental Health Info Session September 20, 2010 This report is available online at www.worksafebc.com
Reported Fatalities & All Reported Injuries *For the years 2000–2008, the deaths included in the table are those that were reported by February of the following year (the exact date varied from February 16 to February 22). For 2009 and subsequent years, the deaths included in the table are those reported by March 31 of the following year. The count of fatalities is slightly more complete for 2009 and subsequent years than it is for 2008 and prior years.
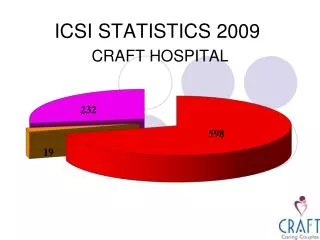
Number and Costs of Claims* • During the year 2009, 94,252 claims were paid for the first time. Of those: • 42,960 were health-care-only claims (formerly called medical-aid-only claims) • 47,651 were short-term disability claims (formerly called wage-loss claims) • 3,520 were long-term disability claims (formerly called permanent disability claims) • 121 were fatal claims * The figures on counts and costs for 2009 have been impacted by two factors: a drop in the number of reported injuries (due at least in part to the recession); and business process changes brought about by the implementation of our CMS initiative.
Distribution by Type of Claim1 1The figures on counts and costs for 2009 have been impacted by two factors: a drop in the number of reported injuries (due at least in part to the recession); and business process changes brought about by the implementation of our CMS initiative.Data have been rounded, so totals may not balance. 2 Data have been rounded, so totals may not balance.
Claim Analysis: Short-term Disability, Long-term Disability and fatal claims first paid
Worker Overall Experience Ratings * Not all columns add up to 100 percent due to rounding.
Injured Workers’ Rating of Assistance with Their Return to Work1 1 Not all columns add up to 100 percent due to rounding.
Employers’ Rating of Their Overall Experience1 1 Not all columns add up to 100 percent due to rounding.