Download
1 / 20
210 likes | 365 Vues
Department of Engineering Management, Information and Systems. EMIS 7305. Systems Reliability, Supportability and Availability Analysis. Supply Chain Analysis. Dr. Jerrell T. Stracener. Objectives Supply Chain Analysis.

E N D
Department of Engineering Management, Information and Systems EMIS 7305 Systems Reliability, Supportability and Availability Analysis Supply Chain Analysis Dr. Jerrell T. Stracener
Objectives Supply Chain Analysis • Analysis provides understanding of critical tradeoffs and alternatives in practical decision-making for a range of inter-related supply chain management issues: • Structure of the Supply Chain: • “Optimal" numbers • Location based on considerations such as customer service requirements, leadtimes, operational costs, and capacities. • Supply Uncertainty: • Relationship with suppliers • Selection of suppliers based on cost, flexibility in supply contracts, expected learning curves of suppliers, and agreements on cost and information sharing. • Operational Policies: • Inventory control policies • Information-sharing strategies.
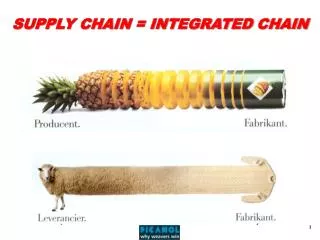
What is a Supply Chain? • Network of Support Resources including: • Material • People • Infrastructure • To provide essential services to: • Store serviceable parts • Repair unserviceable parts • Transport parts between various sites • That sufficiently and efficiently satisfies customer need for: • Asset Management • Asset Demands.
Good Parts Data Bad What is a Supply Chain? Operational Unit Information System Product Use Parts and Information Dispose Product Maintenance Basing Site Local Part Repair Local Stock Dispose Depot/Warehouse Site Depot Part Repair Warehouse Dispose Manufacturing Site Remanufacture Dispose Manufacture
SC Metrics • Availability • Fill rate = # issued divided by number requested • Delay • Backorders = number ordered from next level • Backorder time = average time to issue from next level • Supply Downtime = average time user waits on spare • Transport time = average time to move item from warehouse to user • Repair time = average time to remanufacture item • Retrograde time = average time to return item for remanufacturer • Production lead time = average time to manufacture new item • Efficiency • Turn rate = # issues/ # stocked for period of time (usually annual) • Shelf cost = average value of items on shelf times cost of money factor
Analysis Methodologies • Static • One commodity at one operational site with one supply warehouse • Multi-indentured system at one operational site one supply warehouse • Multi-indentured system at multiple operational sites with a multi-echelon supply chain • Dynamic • Fleet changes • Repairs • Builds • Reallocations
Simple Supply Chain Model • One Item • Driver is MTBD (mean time between demand) for item • AKA MTBR (mean time between removal) • Fill rate(FR) is assessed using POISSON distribution • Given: • Operate time: T • Stockage (# of spares): N • Mean demand: λ = T/MTBD • FR =probability that demand ≤ N = POISSON(N,λ,1)
Number of Failures Model: • Definition • If T ~ E() and if X is the number of failures occurring • in an interval of time, t, then X ~ P(t/ ), the Poisson • Distribution with Probability Mass Function given by: • for x = 0, 1, ... , n • Where = 1/ is the Failure Rate • The expected number of failures in time t is • =t = t/ Stracener_EMIS 7305/5305_Spr08_04.07.08
Poisson Distribution • Mean or Expected Value • Variance and Standard Deviation of X
The Poisson Model: Stracener_EMIS 7305/5305_Spr08_04.07.08
The Poisson Model: Probability Distribution Function 1.0 0.5 0.0 .855 .675 .405 .135 0 1 2 3 4 5 6 7 8 Stracener_EMIS 7305/5305_Spr08_04.07.08
The Poisson Model: Stracener_EMIS 7305/5305_Spr08_04.07.08
The Poisson Model - Example Application: An item has a failure rate of = 0.002 failures per hour if the item is being put into service for a period of 1000 hours. What is the probability that 4 spares in stock will be sufficient? Stracener_EMIS 7305/5305_Spr08_04.07.08
The Poisson Model - Example Application - Solution Expected number of failures (spares required) = t = 2 P(enough spares) = P(x 4) = p(0) + p(1) + p(2) + p(3) + p(4) = 0.945 or about a 5% chance of not having enough spares!
Poisson Distribution - Example When a company tests new tires by driving them over difficult terrain, they find that flat tires externally caused occur on the average of once every 2000 miles. It is found also that the Poisson process yields a useful model. What is the probability that in a given 500 mile test no more than one flat will occur?
Poisson Distribution - Example Solution Here the variable t is distance, and the random variable of interest is X = number of flats in 500 miles Since E(X) is proportional to the time interval involved in the definition of X, and since the average is given as one flat is 2000 miles, we have
Poisson Distribution - Example Solution The values assigned to and t depend on the unit of distance adopted. If we take one mile as the unit, then t = 500, = 0.0005, and t = 1/4. If we take 1000 miles as the unit, then t = 1/2, = 1/2, and again t = 1/4, and so on. The important thing is that t = 1/4, no matter what unit is chosen.
Poisson Model - Example An item has a MTBD of 500 hours. If the item is being put into service for a period of 1000 hours, what is the fill rate probability if 4 spares are in stock?
Poisson Model – Example Solution • Expected demands (spares required) = =1000/500= 2 • P(enough spares) = P(x 4) = p(0) + p(1) + p(2) + p(3) + p(4) = 0.945 • About 95% fill rate.