Download
1 / 20
200 likes | 294 Vues
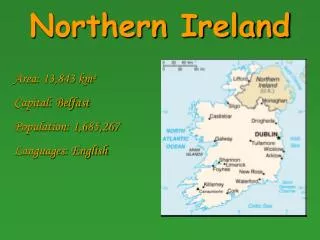
Home Energy Conservation Northern Ireland. Noel Rice N.I.Housing Executive 21 st May 2003. Background. Housing Executive established in 1971 - Single Regional Strategic Housing Authority 26 Local Councils do not have housing remit Built 90,000 homes Reduced unfitness from 20% to 4.9%

E N D
Home Energy Conservation Northern Ireland Noel Rice N.I.Housing Executive 21st May 2003
Background • Housing Executive established in 1971 - Single Regional Strategic Housing Authority • 26 Local Councils do not have housing remit • Built 90,000 homes • Reduced unfitness from 20% to 4.9% • Sold over 100,000 houses to tenants • Manage current stock of 110,000 dwellings • Invest £45m p.a. in private sector grants • HECA Authority since 1996
NI Energy Market • One Housing/HECA Authority • One Electricity Supplier (Levy Manager) • One Gas Company • One HECA Advisory Panel • Two EEACs • 4 Govt Departments have an impact; - DSD (Housing Legislation & Policy) - DFP (Building Regulations) - DETI (Energy Policy) - DoE (Air Quality/Pollution)
Home Energy Conservation Act • Operational on 1 April 1996 • 34% Energy Efficiency Improvement target - fuel switching counts towards NI target • No Statutory Enforcement Powers • No Additional Finance Available • Finance works to own stock and partner others to encourage and, in some cases, fund private sector works • Progress measured in reduced energy use impacts upon fuel poverty/air quality
DOMESTIC ENERGY USE • Energy consumption in 1996 was 79,600T/J • Average SAP in N.I. in 1996 was 41 • Solid fuel was main domestic fuel with oil growing steadily - no natural gas • By 2001 there was a 13% reduction in energy consumption over 1996 figure • Average SAP in N.I. in 2001 was 52
HOUSING STOCK 1996 2001 Dwgs % Dwgs % Owner Occ’d 381,200 63 433,200 67 Private Rented 38,000 6 50,000 8 Housing Exec. 141,200 23 116,200 18 Housing Assoc. 13,000 2 16,100 2 Vacant 29,100 5 32,000 5 TOTAL 602,504 647,500
DOMESTIC FUEL MIX 1991 1996 2001 H.C.S. H.C.S. H.C.S. % % % • Solid Fuel 57.9 40.4 18.4 • Oil 19.6 35.7 58.1 • Dual 4.5 9.3 9.5 • Electricity 11.1 11.4 8.7 • Gas (LPG/Nat) 0.5 1.3 4.1 • Vacancies 5.3 - - • Other 1.1 1.9 1.2
CENTRAL HEATING 1996 2001 LPG 7,870 6,330 Mains Gas 0 20,140 Solid Fuel 183,060 92,060 Oil 215,100 376,170 Electric 52,770 53,960 Dual 56,020 61,510 Other 8,510 5,260 TOTAL 523,330 615,430
NO CENTRAL HEATING 1996 2001 Solid Fuel 60,400 27,100 Electric Fixed 10,330 1,020 Electric Portable 5,170 1,250 Other3,2702,700 TOTAL 79,170 32,070
DOUBLE GLAZING 1996 2001 No % No % Full 147,000 24 302,300 47 Partial 95,000 16 142,800 22 None 360,500 60 202,400 31 TOTAL 602,500 647,500
Cavity Wall Insulation 1996 2001 No % No % Full CWI 219,000 36 324,300 50 Partial CWI 0 0 37,900 6 None 190,200 32 123,800 19 Solid Walls 192,700 32 131,700 20 Dry Lining/Ext 0 0 29,800 5 TOTAL 602,500 647,500
LOFT INSULATION 1996 2001 No % No % Loft Ins 460,500 76 526,900 81 None 70,000 12 34,700 5 Not Applicable 72,000 12 85,900 13 TOTAL 602,500 647,500
Loft Insulation No % Less than 100mm 135,820 26 100 – 150mm 343,520 65 150mm + 22,530 4 Depth unknown 24,990 5 TOTAL 526,860 100
Hot Water Cylinder Insulation Foam Insulation 137,510 21 Insulation Jacket 417,320 65 No Insulation 72,420 11 No Cylinder 20,250 3 TOTAL 647,500 100
Other Energy Measures • Draughtproofing; 67% of households had external doors draughtproofed (48% - 1996) • Low Energy Lighting; 32% of households used low energy bulbs (10% in 1996) • Average SAP now 52; - 37% score 60 + - 41% score between 40 and 59 - 16% score between 20 and 39 - 6% score less than 20
Progress to Date - Public Sector • Revised heating policy fully operational with 9,000 conversions per year - £30m • Over 20,000 NIHE dwellings converted to natural gas • Over 20,000 NIHE dwellings now use oil • Extra £18m to remove Economy 7 • Double Glazing policy being implemented • Residual Insulation prog almost complete • Solar Water, PV & window demonstrations • Staff training programmes ongoing
Progress to Date - Private Sector • Further natural gas and oil conversions - over 18,000 dwellings per year • Cavity Wall Insulation included in Grants • Various Cavity Wall Insulation Schemes including levy projects and Warm Homes • Heating Controls Cashback • Warmth Scheme - natural gas cashback • Double Glazing (25,000 per annum) • Annual Marketing Plans
Progress to Date - Other Tenures • Private Landlords Heating Scheme (250) • Private Landlords Heating Phase 2 • Housing Association Design Guide • HA Energy Efficiency Competition • First CHP scheme in Fold on Falls Rd • North & West Housing - PV project • Staff Training in Housing Associations
Progress to date - All Tenures • Community Energy Plans (Warm Zones) • Pilot schemes to help develop Warm Homes • Fuel Poverty Schemes involving Local Authorities and Health Action Zones • 13% improvement - 8% in England • Carbon Dioxide savings of 2m tonnes p.a. • £82m saved on NI domestic fuel bills • SAP increased from 41 to 52
FUTURE DEVELOPMENTS • Accurate Fuel Poverty estimate- May 2003 • Fitness standard Review • Decent Homes Standard • Increased Energy Efficiency Levy - £3.3m p.a. • Extension of Gas network • DSD Fuel Poverty Strategy • Energy Efficiency on agenda of local politicians and Dept of Health • Partnership remains key