Download
1 / 11
110 likes | 233 Vues
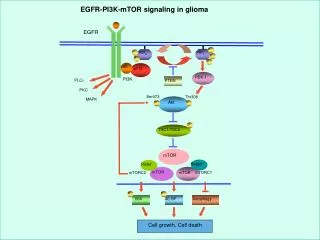
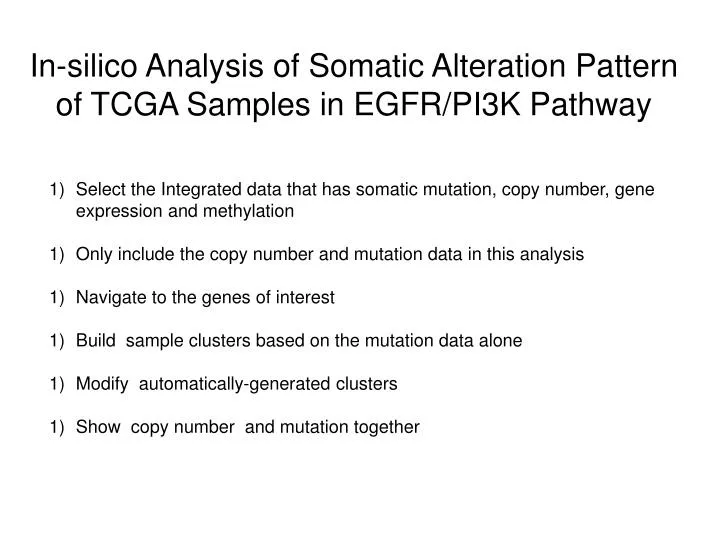
In-silico Analysis of Somatic Alteration Pattern of TCGA Samples in EGFR/PI3K Pathway. Select the Integrated data that has somatic mutation, copy number, gene expression and methylation Only include the copy number and mutation data in this analysis Navigate to the genes of interest

E N D
In-silico Analysis of Somatic Alteration Pattern of TCGA Samples in EGFR/PI3K Pathway Select the Integrated data that has somatic mutation, copy number, gene expression and methylation Only include the copy number and mutation data in this analysis Navigate to the genes of interest Build sample clusters based on the mutation data alone Modify automatically-generated clusters Show copy number and mutation together
Getting started • Go to CGWB heatmap index: https://cgwb.nci.nih.gov/cgi-bin/heatmap
Select Data Set in the Heatmap Viewer Select Gene-based “Integrated data” (i.e. sequence mutation, copy number, expression and methylation) Click
2) Select the appropriate genomic data for this analysis Right-mouse click and scroll to “Display samples for” turn on “mutation”, turn off “expression”
3) Navigate to genes of interest Go to the “Control” menu at the top and select the submenu “Navigation” from the pulldown menu Type in the list of the genes of interest and then hit “New window”
4) Build clusters based on mutations “Turn off” Copy Number Data to Prepare to Cluster sample by Mutation Right-click mouse to run Pearson’s cluster. Samples in gray are not sequenced yet. Only 91 samples are sequenced Gray=unknown, i.e. sample is not sequences
4) Build clusters based on mutations: View results Subgroups created by clustering are divided by yellow lines Change the vertical magnification from 1 to 10 to have a better view
6) Modify automatically-generated clusters You can adjust the clusters by right click the mouse and select the custom sort feature Copy the current list to an excel or word processor and make the changes there and then paste the new list back to the window
Or you can lay the somatic mutations (left) and copy number (right) side-by-side Displays only those that have homozygous deletion or >=3 copy numbers. The setting is derived by going to the Control panel and then select for Color/Contrast