Download
1 / 44
440 likes | 625 Vues
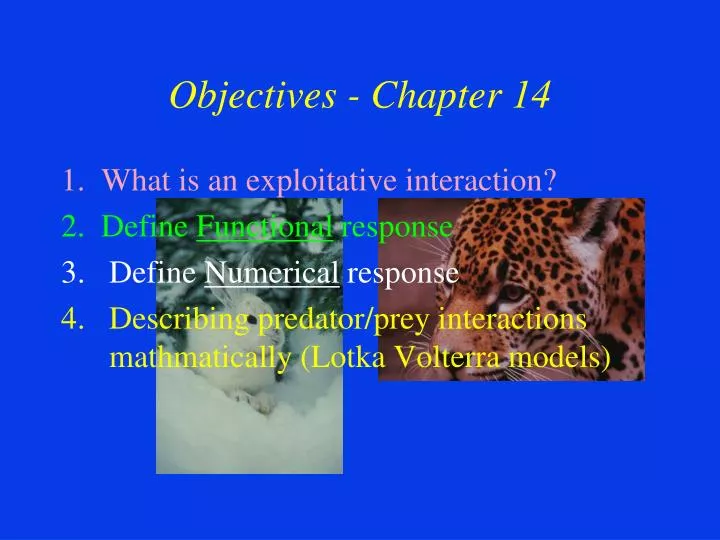
Objectives - Chapter 14. 1. What is an exploitative interaction? 2. Define Functional response Define Numerical response Describing predator/prey interactions mathmatically (Lotka Volterra models). Exploitation (Predation, etc.).

E N D
Objectives - Chapter 14 1. What is an exploitative interaction? 2. Define Functional response • Define Numerical response • Describing predator/prey interactions mathmatically (Lotka Volterra models)
Exploitation (Predation, etc.) • Most important biological interactions - Consumption of one organism (or part thereof) by another
Exploitation (Predation, etc.) Predatorandprey Kill and consume
Exploitation (Predation, etc.) Herbivore and plant Consume, but may not kill
Exploitation (Predation, etc.) Parasite and host Consume, but may not kill, reducing fitness
H. Bogert with Leeches Hirudinea
Parasites • Eat only one or two different organisms during a lifetime--- as opposed to other types of predators (e.g., grazers that eat a large number of plants) • Host and habitat are the same!!! • Leopold - “parasites kill far more organisms than we know” - selection pressure
Exploitation (Predation, etc.) Parasitoid and insect Consume and kill
Exploitation (Predation, etc.) Pathogen Disease, debilitating conditions of host
Exploitation Many relationships not clear cut E.g., Competition between two organisms where one eats the other.
Exploitation Many relationships not clear cut E.g., Herbivore killing plant it feeds on
Exploitation (Predation, etc.) Definitions of each are problematic---- Common to all interactions: One organism living at the expense of another. Exploitation
Responses of Consumer Species to Variation In the Abundance of Their Food Species As the density of the food species increases, the consumer species responds by: • Increasing the rate at which they eat the food species. • “Functional Response”
Theoretical Functional Response Curves Satiation Consumption Rate In Type 1 exploitation interactions, time required to find prey (search time) is the only factor limiting consumption rate. Lo Prey Density Hi Increasing abundance of food organism proportionally reduces searching time, increasing rate of prey consumption. Consumption rate increases until consumers cannot eat any faster (Satiation)
Theoretical Functional Response Curves In Type 2 exploitation interactions, consumption rate is influenced by two separate processes: Searching “Handling” Satiation Consumption Rate At low prey density, searching time limits consumption rate. Lo Prey Density Hi At moderate prey density, handling time limits consumption rate. At high prey density, predator consumption rate limited by satiation.
Theoretical Functional Response Curves In Type 3 exploitation interactions, the consumer eats multiple food species. When a food species is rare, the consumer may ignore it and focus on consuming more common species. As a food species becomes more abundant, the consumer switches to eating more of that species. Prey Switching and Learning Curve Limit Prey Consumption Here
Responses of Consumer Species to Variation In the Abundance of Their Food Species As the density of the food species increases, the consumer species responds by: • Increasing population size due to increased survivorship and reproduction AND immigration from surrounding areas. • “Numerical Response”
Predator Responses Numerical Response: 1. Effect of prey on predator reproduction: • Increased food (prey) • Increased growth rate, survivorship • Earlier reproduction, increased offspring/female, increased females • Increased R and r, increased # predators
Predator Responses Numerical Response: 2. Effect of prey density on predator migration Increased food Residents remain Predators attracted Increased # predators
Numerical Response-Field Examples 1951 1952 1953 Brown Lemming 1-5/acre 15-20 70-80
Numerical Response-Field Examples 1951 1952 1953 Brown Lemming 1-5 15-20 70-80 Pomarine Jaeger uncommon breeding breeding no breeding 4/mi2 18/mi2
Numerical Response-Field Examples 1951 1952 1953 Brown Lemming 1-5 15-20 70-80 Pomarine jaeger uncommon breeding breeding no breeding 4/mi2 18/mi2 Short-eared Owl Absent one record breeding3-4/mi2
Numerical Response-Field Examples 1951 1952 1953 Brown Lemming 1-5 15-20 70-80 Pomarine jaeger uncommon breeding breeding no breeding 4/mi2 18/mi2 Short-eared Owl Absent one record breeding3-4/mi2 Snowy Owl Scarce breeding breeding no breeding .2-.5/mi2 .2-.5/mi2 many non few non
Responses of Consumer Species to Variation In the Abundance of Their Food Species As the density of the food species increases, the consumer species responds by: 3. Combination of #1 and #2. “Combined Response”
Mini Summary:To regulate the food species population, the consumer population must be able to eat food organisms faster than they can reproduce, as determined by: • Consumption rate: (Functional Response). • Consumer Species Rate of Increase: (Numerical Response) • Combined Response of Consumer Species • Consumer Efficiency: Number of food organisms required to produce a new consumer organism.
Lotka Volterra Predator-Prey Model Prey Model - Figure 14.16 dNh/dt = rhNh - pNhNp dNh/dt = Rate of prey population change rh = intrinsic growth rate of prey p = ingestion efficiency Nh = density of prey Np = density of predators
Lotka Volterra Predator-Prey Model Predator Model – Fig. 14.16 dNp/dt = cpNhNp - dpNp dNp/dt = rate of predator change c = production efficiency of predator p = ingestion efficiency Nh = density of prey dp = death rate of predator Np = density of predators
Lotka Volterra Predator-Prey Model Predator population Predator increasing Predator decreasing Prey population
Lotka Volterra Predator-Prey Model Predator isocline Predator population Predator increasing Predator decreasing Prey population
Lotka Volterra Predator-Prey Model Prey decreasing Predator population Prey increasing Prey population
Lotka Volterra Predator-Prey Model Prey decreasing Predator population Prey isocline Prey increasing Prey population
Lotka Volterra Predator-Prey Model Predators decreasing Predators increasing Predator population Prey decreasing Prey decreasing Predators decreasing Predators increasing Prey increasing Prey increasing Prey population
Lotka Volterra Predator-Prey Model Predator population Preypopulation
Lotka Volterra Predator-Prey Model Predator population Preypopulation
Lotka Volterra Predator-Prey Model Predator population Preypopulation
Predator-Prey Model Question: 1. Are prey species populations being regulated by density dependent or density independent controls? 2. What about the predator species?
Summary for Today • Types of exploiters • Functional response • Numerical response predator reproduction predator migration Lotka Volterra predator-prey model


![SALTWATER / BRACKISH-WATER AQ [objectives] Chapter 14](https://cdn3.slideserve.com/6653336/saltwater-brackish-water-aq-objectives-chapter-14-dt.jpg)