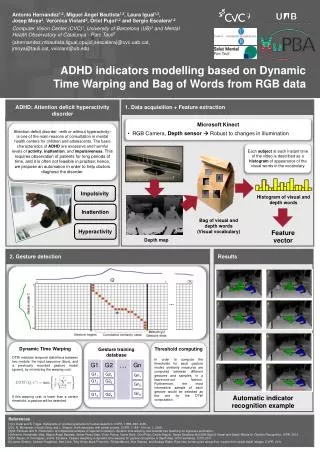
Download
1 / 30
300 likes | 440 Vues
AIRS/IASI Trace Gas Products (Level 2). Jennifer Wei 1,2 , Antonia Gambacorta 1,2 , Eric Maddy 1,2 , Xiaozhen Xiong 1,2 , Fengyin Sun 1,2 , Xingpin Liu 1,2 , Murty Divakarla 2,3 ….. Chris Barnet 2 , Mitch Goldberg 2 START08/pre-HIPPO Workshop Jan. 09, 2008.

E N D
AIRS/IASI Trace Gas Products (Level 2) Jennifer Wei1,2, Antonia Gambacorta1,2, Eric Maddy1,2, Xiaozhen Xiong1,2, Fengyin Sun1,2, Xingpin Liu1,2, Murty Divakarla2,3….. Chris Barnet2, Mitch Goldberg2 START08/pre-HIPPO Workshop Jan. 09, 2008 1Perot Systems Government Services 2NOAA/NESDIS/STAR 3IMSG
Trace Gas Product Potential from Operational Thermal Sounders Haskins, R.D. and L.D. Kaplan 1993
Example of Ozone from AIRS • What has been learned so far….. • High degree of consistency with dynamical variability of UTLS • Realistically map chemical transitions between stratosphere and troposphere • Show reasonable agreement with aircraft data over a large dynamical range of ozone • Comparisons with ozonesonde show good agreement between 400-50 mb range Bian J., A. Gettelman, H. Chen, L. L. Pan (2007), Validation of satellite ozone profile retrievals using Beijing ozonesonde data, J. Geophys. Res., 112, D06305, doi:10.1029/2006JD007502. Monahan K. P., L. L. Pan, A. J. McDonald, G. E. Bodeker, J. Wei, S. E. George, C. D. Barnet, E. Maddy (2007), Validation of AIRS v4 ozone profiles in the UTLS using ozonesondes from Lauder, NZ and Boulder, USA, J. Geophys. Res., 112, D17304, doi:10.1029/2006JD008181. Divakarla et al. (2008), JGR-A, submitted.
Ozone A priori for Version 6 retrieval Consideration of a tropopause referenced climatology Altitude Tropopause referenced Relative Alt. Pan et al, 2004
Example of Carbon Monoxide from AIRS • What has been learned so far…. • CO can be used to estimate horizontal and vertical transport during combustion events. • CO can be used to help us distinguish combustion sources (fossil or biomass) from other sources/sinks in our methane and carbon dioxide products. • CO and Ozone may help us improve atmospheric vertical transport models in the mid-troposphere. Warner, J., M. M. Comer, C. D. Barnet, W. W. McMillan, W. Wolf, E. Maddy, and G. Sachse (2007), A comparison of satellite tropospheric carbon monoxide measurements from AIRS and MOPITT during INTEX-A, J. Geophys. Res., 112, D12S17, doi:10.1029/2006JD007925.
AIRS CO and Trajectories UMBC Courtesy of W. McMillan (mcmillan@umbc.edu) 500 mb 700 mb 850 mb CO from southern Alaska Fires was transported to Europe at high altitudes (5 km) CO from northern Alaskan fires was transported to the lower atmosphere in SE of US
Example of Methane from AIRS (Xiaozhen.Xiong@noaa.gov) • What has been learned so far… • The accuracy is about 0.5-1.5% depending on different altitudes, and sensitive region is at 200-300mb in the tropics and 300-500 mb in the high northern hemisphere (HNH). • Observed significant summer enhancement of CH4 in HNH (possibly due to wetland emissions/thawing permafrost, paper submitted to GRL by Xiong et al.) • Observed significant plume of CH4 over the Tibetan Plateau (collaborate with S. Houweling, paper in preparation) • Use AIRS CH4 in conjunction with model simulations to better quantify the source region
Comparison of CH4 product & ESRL/GMD Continuous Ground Site Barrow Alaska 3deg. x 3deg. gridded retrieval averaged over 60-70 lat, & -165 to -90 long.
AIRS CH4 comparison to ESRL Aircraft Xiong, X., C. Barnet, C. Sweeney, E. S. Maddy, X. Liu, L. Zhou, and M. D. Goldberg (2008), Characterization and Validation of Methane Products from the Atmospheric Infrared Sounder (AIRS), J. Geophys. Res., doi:10.1029/2007JG000500, in press.
CH4 plume over Tibetan Plateau Paper is in preparation
Xiong et al., Satellite Observed Increase of Tropospheric Summer Methane Concentration: Is it due to Wetland Emission over the High Northern Hemisphere?, GRL, 2008 (submitted) AIRS CH4 at 300 mb Courtesy of L. Pan
Example of Carbon Dioxide from AIRS (Eric.Maddy@noaa.gov) • What has been learned so far…. • Maximum measurement sensitivity from AIRS in the middle to upper troposphere – broadly weighted column measurement. • Retrievals require significant spatial and temporal averaging (~5 day / 400 km) to improve S/N. • Total uncertainty in middle-to-upper troposphere: • 1 ppmv in tropics vs. high altitude aircraft (JAL Matsueda) • 2 ppmv in middle/high latitudes vs. ESRL/GMD aircraft. CO2 Retrievals from the Atmospheric Infrared Sounder: Methodology and Validation, Maddy, E. S. and Barnet, C. D. and Goldberg, M. D. and Sweeney, C. and Liu, X., Accepted to JGR-A
Validation: AIRS CO2 (6km – 8km) vs ESRL/GMD Aircraft (2.5km – 8km) • Right: Taylor diagram [Taylor, JGR, 2001] for 2005 aircraft matchups illustrates retrieval skill (end of arrow) relative to a priori (beginning of arrow). • Left: AIRS retrieval and ESRL aircraft timeseries at Poker Flat, Alaska shows good agreement in placement of seasonal cycle and year-to-year variability.
NOAA AIRS CO2 Product is Still in Development • Product is CO2(p) profile with associated averaging kernels. • Measuring a product to 0.5% is inherently difficult • Cloud clearing error (also error estimates) strongly impacts the CO2 product. • Errors in moisture of ±10% is equivalent to ±0.7 ppmv errors in CO2. • Errors in surface pressure of ±5 mb induce ±1.8 ppmv errors in CO2. • AMSU side-lobe errors corrupt the ability to use the 57 GHZ O2 band as a T(p) reference point. Reduction of Core product retrieval errors is critical for CO2. • Currently, we can characterize seasonal and latitudinal mid-tropospheric variability to test product reasonableness. • The real questions is whether thermal sounders can contribute to the source/sink questions. • Requires accurate vertical & horizontal transport models • Having simultaneous O3, CO, CH4, and CO2 products is a unique contribution that thermal sounders can make to improve the understanding of transport.
IASI & AIRS Global Measurements 4 Times/Day • Initial Joint Polar System: an agreement between NOAA & EUMETSAT to exchange data and products. • NASA/Aqua in 1:30 pm orbit (May 2002) • EUMETSAT/IASI in 9:30 am orbit (October 2006) METOP AQUA
The NOAA Unique Level 2 Processing System • The NOAA level 2 processing is a unique system to compute atmospheric core and trace gas products. • The whole architecture is a file-driven system compatible with multiple instruments. • This system has been developed during the Aqua mission, using AIRS/AMSU/MODIS Instruments. • Although the system was built for AIRS, it was designed to be expandable for both IASI and CrIS. • This system has been thoroughly validated using several in-situ measurement campaigns (e.g., ESRL/GMD Aircraft, JAL, INTEX, etc.) • This system is a reliable, well tested and fast package that we are migrating into operations for IASI.
IASI & AIRS Carbon Monoxide ( October 22nd 2007) 1 2 3 4
Spectral Coverage Comparison: AIRS, IASI, & CrIS AIRS, 2378 chs IASI, 8461 chs CrIS, 1305 chs CO2 O3 CH4 CO CO2
Preliminary selection of IASI channels for physical retrieval.(NOTE: All channels except non-LTE are used in regression) Ignored – non- LTE
Instrument Noise, NEΔT at 250 K CO2 CO2 CH4 CO
Preliminary validation results:Temperature, water vapor, ozone(focus day October 19th, 2007)
Near AIRS Nighttime Descending Granules (~4 hour difference)
Standard deviation of retrievals-ECMWFIASI (blue), IASI CLEAR (red) AIRS (cyan), AIRS CLEAR (green) Ozone, O3(p) Temperature, T(p) Water, q(p) Standard Deviation w.r.t. ECMWF Dashed lines are NOAA Cloudy Regression and Solid lines are Physical Retrieval Using Physical QA
Bias of retrievals – ECMWFIASI (blue), IASI CLEAR (red) AIRS (cyan), AIRS CLEAR (green) BIAS w.r.t. ECMWF Dashed lines are NOAA Cloudy Regression and Solid lines are Physical Retrieval Using Physical QA
Towards Operational Status (April 08) • Have not installed the regression derived from cloud cleared radiances. Will be installed in Jan. 2008. • Have not computed tuning for AMSU & MHS (used Aqua AMSU tuning). Will be installed in Jan. 2008. • Have not installed the local angle correction (needed for cloud clearing). Will be installed Jan. 2008. • No attempt has been made to perform sub-pixel ILS correction. • There is an advantage to cloud clearing in that FOV’s are averaged with clearest having highest weight. • This will be studied and installed in version 2. • Only quick optimization has been done. • Need to derive optimal functions & regularization parameters, Jan/Feb. 2008. • Preliminary list of channels looks good, minor changes to channel list. • Pre-launch Radiative Transfer Algorithm (RTA). Post-launch RTA from UMBC, expected any time soon • Empirical bias corrections, empirical noise term (to compensate for sub-pixel ILS), etc. are still very crude.
Our interest in participating to the START 08/pre-HIPPO campaign: • Compare with in situ co-located trace gas measurements to validate and assess the performance of IASI L2 products • Exchange data and products chris.barnet@noaa.gov antonia.gambacorta@noaa.gov