Download
1 / 16
160 likes | 287 Vues
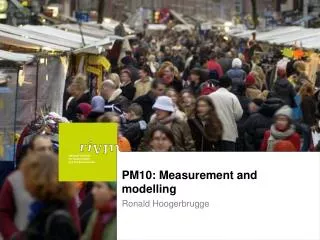
Swedish experiences of applying the Quality Objectives for NO2 and PM10 modelling. introduction model evaluation for Swedish - street/road stations - urban background stations discussion and conclusions. b y L. Gidhagen, G. Omstedt and S. Andersson. Indicators for model quality.

E N D
Swedish experiences of applying the Quality Objectives for NO2 and PM10 modelling • introduction • model evaluation for Swedish - street/road stations- urban background stations • discussion and conclusions by L. Gidhagen, G. Omstedt and S. Andersson
Indicators for modelquality Model quality objectives (uncertainty) as described in the AQ directive Fairmode http://fairmode.ew.eea.europa.eu/ The uncertainty of modelling estimation is defined as the maximum deviation between the measured and calculated concentration levels for 90 % of individual monitoring points, without taking into account the timing of the events. The average annual modelling uncertainty for NO2 is defined as ±30% and for percentiles ±50% Op and Mp are the observed and modelled concentrations at the percentile (p) OLV and MLV are the closed observed and measured concentration to the limit value concentration (LV)
Modelvalidation in Sweden ~ 30 road/street stations ~ 20 urban background stations SIMAIR Gidhagen, L., Johansson, H. and Omstedt, G., 2009: SIMAIR - Evaluation tool for meeting the EU directive on air pollution limits. Atmospheric Environment, 43, 1029-1036, doi:10.1016/j.atmosenv.2008.01.056. Andersson, S. och Omstedt, G., 2009: Valideringav SIMAIR mot mätningarav PM10, NO2 ochbensen. Utvärderingförsvenskatätorterochtrafikmiljöeravseendeår 2004 och 2005. SMHI Meteorologi, Nr. 137, 125 pp. (In Swedish).
Validationresults from 2004 and 2005 Validation performed using both RPE and RDE • Swedish EPA recommends the use of RPE for quality check of hourly (NO2) and daily (PM10, NO2) values. • Swedish EPA supports FAIRMODE recommendation to use, for annual mean values, the RDE calculation when observed value is low compared to limit value. For high observed annual mean values, RPE can be used. • We are left with some confusion, e.g.:- Not clear when to use RDE or RPE- Not clear how the 90% of the station comparisons are selected: - How big can the area be (entire Sweden)? - Should the comparison include only one specific year or can we include comparisons for the same station but for two different years?- Why is max(RPE) or max(RDE) selected, would not median be more useful? Or both?
Validation PM10 from 2004 and 2005 Model simulations of PM10 for streetlevel show acceptable quality, evenfor 98-percentiles Differences MRPE and MRDE?
Validation PM10 from 2004 and 2005 using RPE and RDE With RDE the quality is OK, with RPE it is almostOK (although MRPE for daily PM10 is still not defined)
Couldmed(RPE) and med(RDE) be a better alternative? RPE and RDE for PM10 Same station There are often a few “poor” stations where measurement errors or bad siting (low representativeness) can be suspected
Examples for PM10: Howwill RPE differ from RDE? Kungsgatan/Norrköping year 2004 Hornsgatan/Stockholm year 2000 Annualmean:RPE = 44%RDE = 20% Annualmean:RPE = 1%RDE = 6% Eriksgatan/Landskrona year 2004 Graphs illustrate RPE and RDE for daily 90-percentiles Annualmean:RPE = 30%RDE = 18%
Modell evaluationof NO2 at street/road level Model simulations of NO2 for streetlevel show acceptable quality, evenfor hourlyvalues
Validation NO2 from 2004 and 2005 using RPE and RDE Daily and hourlypercentiles OK, annualmeansalmost OK
Modell evaluationof NO2 in urban backgroundusing RPE BUM new: MRPE annual mean = 0.40 MRPE 98-percentile daily mean = 0.48 MRPE 90-percentile hourly mean = 0.49 Improvements in the model can be demonstrated byimproved RPE The current quality objectivesare still not fully compliant in urban background annual mean values
Can MRPE and MRDE be used as uncertainties? Example: SIMAIR for PM10 Can we use MRPE and MRDE as uncertainties on the simulated levels? Example: calculated yearly mean PM10 concentration is 25 µg/m3 and calculated 90-percentil is 45 µg/m3 then the uncertainties are: MRPE: Yearly mean: 25 +/-9.8 µg/m3 i.e. between 15.3 - 34.8 µg/m3 90-percentile (daily mean): 45 +/- 23.0 µg/m3 i.e. between 22.1 - 68.0 µg/m3 MRDE: Yearly mean: 25 +/- 9.6 µg/m3 i.e. between 15.4 - 34.6 µg/m3 90-percentile (daily mean): 45 +/- 22.5 µg/m3 i.e. between 22.5 - 67.5 µg/m3 Likely those intervals are too large for a general public?
Conclusions Are the quality objectives (QA) obtainable and relevant? Answer: Yes, but… • Some confusion on how to calculate MRPE and MRDE which must be eliminated. • The indicator should reflect model uncertainty as much as possible. In our opinion RPE is a better indicator than RDE, especially for Swedish conditions with air quality levels often well below the limited values. • It is unclear if and how these indicators can be used, except for showing compliance of Directive’s “Quality objectives for models”. For describing model uncertainties in a broader sense other and more refined indicators are needed (Delta tool…). Thankyou for your attention!
PM10 in Swedish cities (2004): Importanceoflocalcontribution