Download
1 / 1
10 likes | 107 Vues
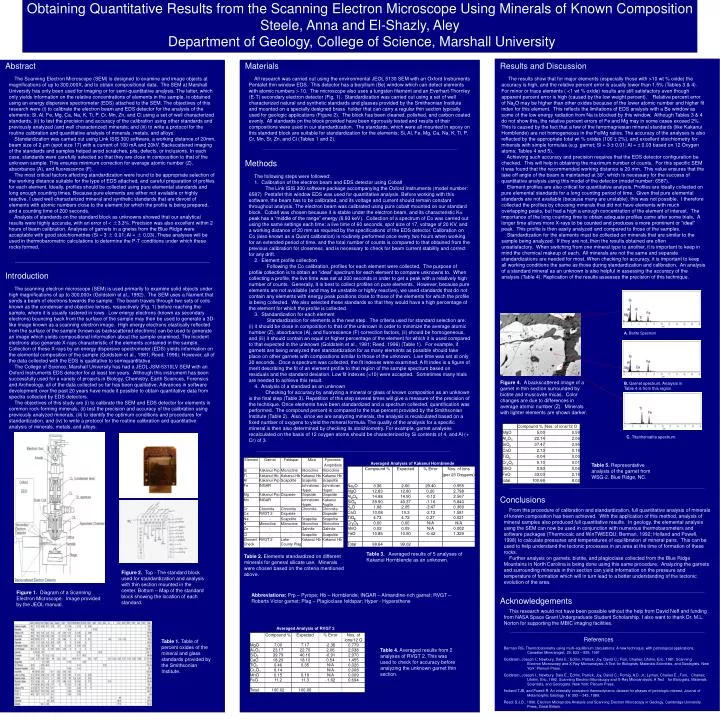
Obtaining Quantitative Results from the Scanning Electron Microscope Using Minerals of Known Composition Steele, Anna and El-Shazly, Aley Department of Geology, College of Science, Marshall University. A. Biotite Spectrum.

E N D
Obtaining Quantitative Results from the Scanning Electron Microscope Using Minerals of Known Composition Steele, Anna and El-Shazly, Aley Department of Geology, College of Science, Marshall University A. Biotite Spectrum Figure 4. A backscattered image of a garnet in thin section surrounded by biotite and muscovite micas. Color changes are due to differences in average atomic number (Z). Minerals with lighter elements are shown darker. B. Garnet spectrum. Analysis in Table 4 is from this region. C. Titanhematite spectrum. Materials Results and Discussion Abstract The Scanning Electron Microscope (SEM) is designed to examine and image objects at magnifications of up to 300,000X, and to obtain compositional data. The SEM at Marshall University has only been used for imaging or for semi-quantitative analysis. The latter, which only yields information on the relative concentrations of elements in the sample, is obtained using an energy dispersive spectrometer (EDS) attached to the SEM. The objectives of this research were (i) to calibrate the electron beam and EDS detector for the analysis of the elements: Si, Al, Fe, Mg, Ca, Na, K, Ti, P, Cr, Mn, Zn, and Cl using a set of well characterized standards, (ii) to test the precision and accuracy of the calibration using other standards and previously analyzed (and well characterized) minerals; and (iii) to write a protocol for the routine calibration and quantitative analysis of minerals, metals, and alloys. Standardization was carried out using Link ISIS 300 software, a working distance of 20mm, beam size of 2 µm (spot size 17) with a current of 100 mA and 20kV. Backscattered imaging of the standards and samples helped avoid scratches, pits, defects, or inclusions. In each case, standards were carefully selected so that they are close in composition to that of the unknown sample. This ensures minimum correction for average atomic number (Z), absorbance (A), and fluorescence (F). The most critical factors affecting standardization were found to be appropriate selection of the working distance suitable for the type of EDS attached, and careful preparation of profiles for each element. Ideally, profiles should be collected using pure elemental standards and long enough counting times. Because pure elements are either not available or highly reactive, I used well characterized mineral and synthetic standards that are devoid of elements with atomic numbers close to the element for which the profile is being prepared, and a counting time of 200 seconds. Analysis of standards on the standard block as unknowns showed that our analytical results were highly accurate, with an error of < ±3.3%. Precision was also excellent within 2 hours of beam calibration. Analyses of garnets in a gneiss from the Blue Ridge were acceptable with good stoichiometries (Si = 3 ± 0.01; Al = ± 0.03). These analyses will be used in thermobarometric calculations to determine the P-T conditions under which these rocks formed. All research was carried out using the environmental JEOL 5130 SEM with an Oxford Instruments Pentafet thin window EDS. This detector has a beryllium (Be) window which can detect elements with atomic numbers > 10. The microscope also uses a tungsten filament and an Everhart-Thornley (E-T) secondary electron detector (Fig. 1). Standardization was carried out using a set of well characterized natural and synthetic standards and glasses provided by the Smithsonian Institute and mounted on a specially designed brass holder that can carry a regular thin section typically used for geologic applications (Figure 2). The block has been cleaned, polished, and carbon coated evenly. All standards on the block provided have been rigorously tested and results of their compositions were used in our standardization. The standards, which were all mounted in epoxy on this standard block are suitable for standardization for the elements: Si, Al, Fe, Mg, Ca, Na, K, Ti, P, Cr, Mn, Sr, Zn, and Cl (Tables 1 and 2).. The results show that for major elements (especially those with >10 wt % oxide) the accuracy is high, and the relative percent error is usually lower than 1.5% (Tables 3 & 4). For minor or trace elements ( <1 wt % oxide) results are still satisfactory even though apparent percent error is high (caused by the low weight percent). Relative percent error of Na2O may be higher than other oxides because of the lower atomic number and higher fit index for this element. This reflects the limitations of EDS analysis with a Be window as some of the low energy radiation from Na is blocked by this window. Although Tables 3 & 4 do not show this, the relative percent errors of Fe and Mg may in some cases exceed 2%. This is caused by the fact that a few of the ferromagnesian mineral standards (like Kakanui Hornblende) are not homogeneous in the Fe/Mg ratios. The accuracy of the analyses is also reflected by the appropriate total wt % oxides (100 ± 2%), and excellent stoichiometry for minerals with simple formulas (e.g. garnet; Si = 3 ± 0.01; Al = ± 0.03 based on 12 Oxygen atoms; Tables 4 and 5). Achieving such accuracy and precision requires that the EDS detector configuration be checked. This will help in obtaining the maximum number of counts. For this specific SEM it was found that the recommended working distance is 20 mm. This value ensures that the take off angle of the beam is maintained at 30°, which is necessary for the success of quantitative analysis using this model of the detector (model number: 6587). Element profiles are also critical for quantitative analysis. Profiles are ideally collected on pure elemental standards for a long counting period of time. Given that pure elemental standards are not available (because many are unstable), this was not possible. I therefore collected the profiles by choosing minerals that did not have elements with much overlapping peaks, but had a high a enough concentration of the element of interest. The importance of the long counting time to obtain adequate profiles came after some trials. A longer time allows more X-rays to be counted and produces a more prominent or “ideal” peak. This profile is then easily analyzed and compared to those of the samples. Standardization for the elements must be collected on minerals that are similar to the sample being analyzed. If they are not, then the results obtained are often unsatisfactory. When switching from one mineral type to another, it is important to keep in mind the chemical makeup of each. All minerals are not the same and separate standardizations are needed for most. When checking for accuracy, it is important to keep all working conditions the same as those during standardization and calibration. An analysis of a standard mineral as an unknown is also helpful in assessing the accuracy of the analysis (Table 4). Replication of the results assesses the precision of this technique. Methods The following steps were followed: 1. Calibration of the electron beam and EDS detector using Cobalt The Link ISIS 300 software package accompanying the Oxford Instruments (model number: 6587) Pentafet thin window EDS was used for quantitative analysis. Before working with this software, the beam has to be calibrated, and its voltage and current should remain constant throughout analysis. The electron beam was calibrated using pure cobalt mounted on our standard block. Cobalt was chosen because it is stable under the electron beam, and its characteristic K peak has a “middle of the range” energy (6.93 keV). Collection of a spectrum of Co was carried out using the same settings each time: a live time of 60 seconds, spot size of 17, voltage of 20 KV, and a working distance of 20 mm as required by the specifications of the EDS detector. Calibration on Co (also known as a Quant calibration) is routinely performed once every two hours when working for an extended period of time, and the total number of counts is compared to that obtained from the previous calibration for closeness, and is necessary to check for beam current stability and correct for any drift. 2. Element profile collection Following the Co calibration, profiles for each element were collected. The purpose of profile collection is to obtain an “ideal” spectrum for each element to compare unknowns to. When collecting a profile, the live time was set at 200 seconds in order to get a peak with a relatively high number of counts. Generally, It is best to collect profiles on pure elements. However, because pure elements are not available (and may be unstable or highly reactive), we used standards that do not contain any elements with energy peak positions close to those of the elements for which the profile is being collected. We also selected these standards so that they would have a high percentage of the element for which the profile is collected. 3. Standardization for each element Standardization for elements is the next step. The criteria used for standard selection are: (i) it should be close in composition to that of the unknown in order to minimize the average atomic number (Z), absorbance (A), and fluorescence (F) correction factors, (ii) should be homogeneous, and (iii) it should contain an equal or higher percentage of the element for which it is used compared to that expected in the unknown (Goldstein et al., 1981; Reed, 1996) (Table 1). For example, if garnets are being analyzed then standardization for as many elements as possible should take place on other garnets with compositions similar to those of the unknown. Live time was set at only 30 seconds. Once a spectrum was collected, the fit indexes were examined. A fit index is a figure of merit describing the fit of an element profile to that region of the sample spectrum based on residuals and the standard deviation. Low fit indexes (<10) were accepted. Sometimes many trials are needed to achieve this result. 4. Analysis of a standard as an unknown Checking for accuracy by analyzing a mineral or glass of known composition as an unknown is the final step (Table 3). Repetition of this step several times will give a measure of the precision of the technique. Once elements have been standardized and a spectrum collected, quantification was performed. The compound percent is compared to the true percent provided by the Smithsonian Institute (Table 2). Also, since we are analyzing minerals, the analysis is recalculated based on a fixed number of oxygens to yield the mineral formula. The quality of the analysis for a specific mineral is then also determined by checking its stoichiometry. For example, garnet analyses recalculated on the basis of 12 oxygen atoms should be characterized by Si contents of 4, and Al (+ Cr) of 3. Introduction The scanning electron microscope (SEM) is used primarily to examine solid objects under high magnifications of up to 300,000x (Goldstein et al., 1992). The SEM uses a filament that sends a beam of electrons towards the sample. The beam travels through two sets of coils known as the condenser and objective lenses, respectively (Fig. 1) before reaching the sample, where it is usually rastered in rows. Low energy electrons (known as secondary electrons) bouncing back from the surface of the sample may then be used to generate a 3D-like image known as a scanning electron image. High energy electrons elastically reflected from the surface of the sample (known as backscattered electrons) can be used to generate an image which yields compositional information about the sample examined. The incident electrons also generate X-rays characteristic of the elements contained in the sample. Collection of these X-rays by an energy dispersive spectrometer (EDS) yields information on the elemental composition of the sample (Goldstein et al., 1981; Reed, 1996). However, all of the data collected with the EDS is qualitative to semiquantitative. The College of Science, Marshall University has had a JEOL JSM-5310LV SEM with an Oxford Instruments EDS detector for at least ten years. Although this instrument has been successfully used for a variety of projects in Biology, Chemistry, Earth Sciences, Forensics and Archeology, all of the data collected so far has been qualitative. Advances in software development over the past 20 years have made it possible to obtain quantitative data from spectra collected by EDS detectors. The objectives of this study are (i) to calibrate the SEM and EDS detector for elements in common rock-forming minerals, (ii) test the precision and accuracy of the calibration using previously analyzed minerals, (iii) to identify the optimum conditions and procedures for standardization, and (iv) to write a protocol for the routine calibration and quantitative analysis of minerals, metals, and alloys. Averaged Analysis of Kakanui Hornblende Table 5. Representative analysis of the garnet from WSG-2, Blue Ridge, NC. Conclusions From this procedure of calibration and standardization, full quantitative analysis of minerals of known composition has been achieved. With the application of this method, analysis of mineral samples also produced full quantitative results. In geology, the elemental analysis using the SEM can now be used in conjunction with numerous thermobarometers and software packages (Thermocalc and WinTWEEQU; Berman, 1992; Holland and Powell, 1998) to calculate pressures and temperatures of equilibration of mineral pairs. This can be used to help understand the tectonic processes in an area at the time of formation of these rocks. Further analysis on garnets, biotite, and plagioclase collected from the Blue Ridge Mountains in North Carolina is being done using this same procedure. Analyzing the garnets and surrounding minerals in thin section can yield information on the pressure and temperature of formation which will in turn lead to a better understanding of the tectonic evolution of the area. Table 3. Averaged results of 5 analyses of Kakanui Hornblende as an unknown. Table 2. Elements standardized on different minerals for general silicate use. Minerals were chosen based on the criteria mentioned above. Figure 2. Top - The standard block used for standardization and analysis with thin section mounted in the center. Bottom – Map of the standard block showing the location of each standard. Figure 1. Diagram of a Scanning Electron Microscope. Image provided by the JEOL manual. Abbreviations: Prp – Pyrope; Hb – Hornblende; INGAR – Almandine-rich garnet; RVGT – Roberts Victor garnet; Plag – Plagioclase feldspar; Hyper - Hypersthene Acknowledgements This research would not have been possible without the help from David Neff and funding from NASA Space Grant Undergraduate Student Scholarship. I also want to thank Dr. M.L. Norton for supporting the MBIC imaging facilities. Averaged Analysis of RVGT 2 References Table 1. Table of percent oxides of the mineral and glass standards provided by the Smithsonian Institute. Berman RG, Thermobarometry using multi-equilibrium calculations: A new technique, with petrological applications, Canadian Mineralogist, 29: 833 – 855, 1991. Goldstein, Joseph I.; Newbury, Dale E.; Echlin, Patrick; Joy, David C.; Fiori, Charles; Lifshin, Eric, 1981. Scanning Electron Microscopy and X-Ray Microanalysis: A Text for Biologists, Materials Scientists, and Geologists. New York: Plenum Press. Goldstein, Joseph I.; Newbury, Dale E.; Echlin, Patrick; Joy, David C.; Romig, A.D. Jr.; Lyman, Charles E.; Fiori, Charles; Lifshin, Eric, 1992. Scanning Electron Microscopy and X-Ray Microanalysis: A Text for Biologists, Materials Scientists, and Geologists. New York: Plenum Press. Holland TJB, and Powell R, An internally consistent thermodynamic dataset for phases of petrologic interest, Journal of Metamorphic Geology, 16: 393 – 343, 1989. Reed, S.J.B., 1996. Electron Microprobe Analysis and Scanning Electron Microscopy in Geology. Cambridge University Press, Great Britain. Table 4. Averaged results from 2 analyses of RVGT 2. This was used to check for accuracy before analyzing the unknown garnet thin section.