Download
1 / 20
200 likes | 281 Vues
Measurement. Common Metric Prefixes. International System of Measurement ( SI ). SI units form a base-10 or decimal system. kilo….hecto….deka….BASE….deci….centi….milli. 1000 100 10 1 0.1 0.01 0.001. meter gram liter. example: 6,532,492cm => ?km.

E N D
International System of Measurement (SI) • SI units form a base-10 or decimal system. kilo….hecto….deka….BASE….deci….centi….milli 1000 100 10 1 0.1 0.01 0.001 meter gram liter example: 6,532,492cm => ?km 65.32492km example: 0.00032kg => ?g 0.32g
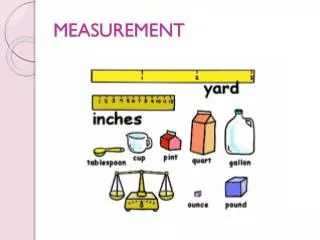
Measurement Common units of measurements and equipment to use-- • Mass: g, kg • Use balance or scale • Distance: mm, cm, m, km • Use ruler or meter stick • Volume: ml, L, cm3 • Use graduated cylinder • Temperature: ºC, ºF, Kelvin • Use thermometer • Time: seconds, minutes, hours….. • Use stop watch = most common
Precision, Accuracy, and Resolution • Precision • describes how close together repeated measurements or events are to one another-- even if it is wrong • Accuracy • how close the measurement is to the correct answer • Resolution • the smallest amount that can be measured
Significant digits (figures) • are the meaning full digits in a measurement • meaningful the numbers the equipment can measure AND one more that you estimate
best answer is around 2.63 cm • to a scientist this number means “between 2.60 and 2.70 cm.” • the last digit, 3, representing the smallest amount, is uncertain, but it is still significant • always “push it” one more decimal place by estimating
Graphing “MIXES TUL” • M: maximize your graph (use all of the graph paper) • IX: Independent variable on X-axis (dependent variable on y-axis) • ES: Equally Spaced scale increments (start at 0) • T: Title (descriptive and mentions the y-variable vs. x-variable) • UL: Units and Labels on both axes
Types of Graphs • Line or scatterplot graphs • can help determine if two variables are related • can connect the dots or sometimes draw a line of best fit
Bar Graphs • used when you want to compare different data such as objects or events
Pie Graphs • show the amount each part makes of up of the whole (100%).