Download
1 / 42
430 likes | 620 Vues
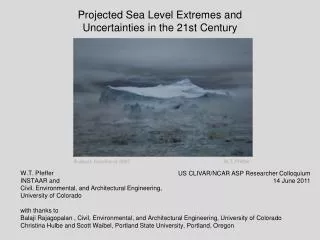
Present-Day Sea Level Change Assessment and Key Uncertainties Anny Cazenave LEGOS, Toulouse. 20 th century sea level rise. Satellite altimetry. Holgate and Woodworth, 2004. 1.8 +/- 0.3 mm/yr. Church et al., 2004, 2006. Global mean sea level from Topex/Poseidon altimetry.

E N D
Present-Day Sea Level Change Assessment and Key Uncertainties Anny Cazenave LEGOS, Toulouse
20th century sea level rise Satellite altimetry Holgate and Woodworth, 2004 1.8 +/- 0.3 mm/yr Church et al., 2004, 2006
Global mean sea level from Topex/Poseidon altimetry Rate of rise : 3.0 +/-0.4 mm/yr With PGR correction : 3.3 +/- 0.4 mm/yr 1993-2005
Observed rate of sea level rise: • 1950-2000 : 1.8 +/-0.3 mm/yr • 1993-2005 : 3.3 +/- 0.4 mm/yr • Acceleration? • Decadal fluctuation? • Influence of other processes? • (e.g., recovery of Pinatubo eruption)
Regional variability from historical tide gauges New York Brest Honolulu Buenos-Aires 2000 Time 1900
Causes of sea level change…. • - Thermal expansion of sea water • due to ocean warming • -Ocean mass change due to water mass exchange with glaciers, ice sheets and land reservoirs
Ocean temperature data 1950-2005 In situ hydrographic profiles
World Ocean Temperature Data Bases • ‘ Global ’ time series of ocean temperature data • at different depths: • 1. Levitus et al. (2005) • 0-700 m : global yearly grids for 1955-2003 • 0-3000 m : global 5-year grids for 1955-1998 • 2. Ishii et al. (2006) • 0-700 m : global monthly grids for 1950-2005 • 3. Willis et al. (2004)/Lyman et al. (2006) • 0-750 m : yearly data for 1993-2003 • 4. Guinehut et al. (2006)-ARMOR- • 0-700 m : yearly data for 1993-2003 • 5.Domingues et al. (2006) • 0-750 m: 1993-2005 In situ + altimetry
Thermal budget in the Earth system Past 50 years (1022 J) Oceans Ocean warming Land warming Glaciers melting Atmosphere warming Sea ice melting From Levitus et al. (2005)
Observed sea level and thermal expansion Past few decades Observed sea level + 1.8 ±0.3 mm/yr Thermal expansion ~ 0.4 ±0.1 mm/yr
Thermal expansion (1993-2003) : + 3.1 ±0.4 mm/yr Average rate : 1.5 ± 0.3 mm/yr Levitus 1.3 mm/yr Ishii 1.2 mm/yr Willis 1.6 mm/yr ARMOR 1.8 mm/yr
Contribution of thermal expansion (1993-2005) Observed sea level rise : 3.3 mm/yr Thermal expansion : 0.8 mm/yr Residual : ocean mass change 2.5mm/yr
Causes of Regional Variability • in Sea Level Change?
Spatial patterns of steric sea level (thermal expansion) and observed sea level (satellite altimetry) trends (1993-2005) mm/yr mm/yr mm/yr Thermal Expansion Satellite Altimetry
Residual sea level trends (Observed sea level by satellite altimetry minus thermal expansion) --------------- 1993-2005 Causes…. Salinity?, Deep ocean temperature? Post-Glacial Rebound? Others?
Trend patterns :Comparison Models - Observations GECCO Model (1992-2001) Topex/Poseidon (1993-2001) From position paper ‘Thermal Expansion’
Thermal expansion 1955-2003 Thermal expansion 1993-2003 EOF1 1955-2003 Thermal expansion 1955-2003 Lombard et al. (2005)
Land Ice Contribution (past few years) Dyugerov and Meier, 2005 Cogley, 2005 ……… Rignot & Thomas, 2002 Thomas et al., 2004 Krabill et al., 2004 Zwally et al., 2005 Johanessen et al., 2005 Davis et al., 2005 Rignot & Kanagaratnam, 2006 Rignot et al., 2006 Velicogna & Wahr (2005, 2006) Ramillien et al. (2006) ……….
Glaciers contribution to sea level 0.8 +/- 0.4 mm/yr From Position Paper ‘Cryospheric Contributions’
Contribution of Ice sheets to Sea Level 1. Greenland Zwally et al. (2005) Krabill et al. (2004) Thomas et al. (2006) Vellicogna and Wahr (2005) Ramillien et al. (2006) Rignot & Kanagaratnam (2006) 0.3 +/- 0.15 mm/yr 2. Antarctica : « probable net loss but close to balance » From Position Paper ‘Cryospheric Contributions’
WATER CYCLE Precipitation Glaciers Evaporation Transpiration Snow Lakes Wetlands Ocean Rivers Soil wetness Ground waters dW / dt = P - E - R Water Balance Equation Precipitation Total land water storage Evapotranspiration Runoff
Land water Storage (climate-driven) contribution Milly et al. (2003) LaD model Ngo-Duc et al. (2005) ORCHIDEE model Detrended thermal expansion
Land Water Contribution(Climatic + Anthropogenic) (recent decades) • Reservoir filling : - 0.25 mm/yr • Groundwater mining : + 0.25 mm/yr • 14 largest lakes : + 0.15 mm/yr • Climate-driven : -0.1 mm/yr • Water vapour : - 0.05 mm/yr • Net budget : ~ 0 But : many unknowns (irrigation,ground water, deforestation, urbanization….) From Position Paper ‘Terrestrial Waters’; Milly et al.
Sea Level Budget • ---------------- • Recent Years
Contribution of thermal expansion plus land ice to sea level rise (1993-2005) -1. 0. 1. 2. 3. 4. mm/yr Thermal Expansion 1. +/- 0.5 Land ice 1.1 +/- 0.6 Thermal expansion plus land ice 2.2 +/- 0.8 ? 3.3 +/- 0.4 Satellite altimetry
Thermal expansion and salinity • uncertainties • Data coverage (southern ocean, deep ocean) • Data processing
Land ice and land waters • uncertainties • Ice sheets mass balance • Continental waters • Anthropogenic effects (dams, ground water removal, irrigation)
NEAR FUTURE PERSPECTIVES ALTIMETRY for measuring sea level • Long sea level time series ARGO • Thermal expasion + salinity • Land waters (climate + human activities) • Ice sheets mass balance • Ocean mass change + thermal expansion GRACE Swath altimetry • Surface Waters monitoring
Change in land water storage (climatic + anthropogenic) from GRACE seasonal change 30 March 2003 30 September 2003 Resolution : 400 km
Change in land water storage (climatic + anthropogenic) from GRACE : Trend over a 3-year time span (mid-2002 to mid-2005) Water height equivalent (mm/yr)
Mekonk basin (south-east Asia) Kg Luong - ERS2 track 476 d= 6 Km Global rms 0.24 m Water level (cm) Moc Hoa - T/P track 140 Water level (cm) d= 2 Km Global rms 0.15 m THERMAL EXPANSION (Steric Sea Level) Satellite altimetry minus GRACE In situ ocean temperature data Lombard et al., 2006 Also, Chambers et al., 2004; Chambers et al., 2006
Lake water level monitoring by satellite altimetry (Irak) (Asia) (Africa) (Africa)
New space mission for land hydrology WatER 'Water Elevation Recovery'
Remaining puzzling questions • Sea level rise : recent acceleration? • Cause of thermal expansion differences among data sets (recent years)? • Cause of ocean cooling since 2004 and discrepancy with satellite altimetry observations? • Sea level budget for the last 13 years not closed; Cause? • ocean temperature-based thermal expansion? • Are fingerprints of PGR and present-day ice melt detectable? • .…..