Download
1 / 22
220 likes | 377 Vues
environmental friendLy foliar nutritive fluids chemical stress by chlorophyll fluorescence. Aura Dana Ionita, Viorica Chitu, Emil Chitu, Marina Cirjaliu-Murgea, Nicoleta Teodorut, Laurentiu Filipescu Department of Technology of Inorganic Substances and Environmental Protection

E N D
environmental friendLy foliar nutritive fluids chemical stress by chlorophyll fluorescence Aura DanaIonita, Viorica Chitu, Emil Chitu, Marina Cirjaliu-Murgea, Nicoleta Teodorut, Laurentiu Filipescu Department of Technology of Inorganic Substances and Environmental Protection Faculty of Applied Chemistry and Material Science, University Politehnica of Bucharest, Phone: (021)4023885, e-mail: iauradana@yahoo.com ICDP Research Institute for Fruit Growing Pitesti – Maracineni Romanian International Conference of Chemistry and Chemical Engineering, RICCCE 16, Bucharest, 2009
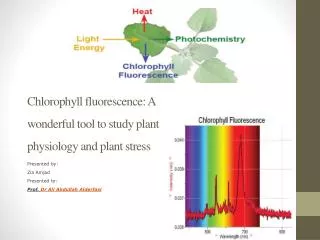
Photosynthesis • Chlorophyll fluorescence is a non-invasive approach to energetics of the photosystem II (PSII). • Light absorbed by chlorophyll from leaves is consumed in three processes: • a) photosynthesis (photochemistry); • b) dissipation as heat; • c) re-emission as red fluorescence (Figure 1). • The total yield in energy adsorption is constant and subsumes the yields of the all three processes. • Photochemistry (P) + Fluorescence (F) + Heat production (D) = 1
Figure 1: Absorption and emission spectrum of chlorophyll a.
Consequently, the measurements of the yield of chlorophyll fluorescence grant significant information about photosynthesis share in captured energy consumption and heat losses by dissipation (Figure 2). Figure 2. Transformation of light energy into chemically fixed energy by charge separation at photosystem II reaction centers
Light energy absorbed by photosystem II antenna pigments, (h • v)A, is transfered by inductive resonance to the reaction center chlorophyll (P 680) which mediates reduction of an acceptor Q by a donor D; At the donor side accumulation of positive charges leads to the splitting of H2O; At the acceptor side electrons are taken up by the plastoquinone pool (PQ) from which they are transported via photosystem I to NADP (nicotinamide adenine dinucleotide phosphate) and eventually into the Calvin cycle to reduce CO2 . Minimum fluorescence level, (h • v)F, occurs at a minimum level (O~level) for all centers being open (acceptor Q completely oxidized); Maximum fluorescence level is reached upon complete reduction of Q. Schreiber, U., Chlorophyll fluorescence yield changes as a tool in plant, physiology I. The measuring system Photosynthesis Research 4, 1983, p.361-373.
Principle of measurements • Each quantum of light absorbed by a chlorophyll molecule rises an electron from the ground state to an excited state. • Upon de-excitation from a chlorophyll a molecule from excited state 1 to ground state, a small proportion (3-5% in vivo) of the excitation energy is dissipated as red fluorescence. • The rest of de-excitation energy is discharge in: • primarily photochemistry; • secondarily in heat dissipation (enzymes activation, transpiration, mineral transport, etc.). • Therefore, changes in the fluorescence yield reflect changes in photochemical efficiency and heat dissipation rate.
A typical measurement on a healthy leaf by the saturation pulse method is shown in Figure 3(Fracheboud, Y.,Using chlorophyll fluorescence to study photosynthesis, www.ab.ipw.agrl.ethz.ch/~yfracheb/flex.htm). Figure 3. Measurement of chlorophyll fluorescence
Steps: • plant leaf is dark adapted for 20 minutes prior to the measurement minimum (basic) chlorophyll fluorescence is measured, Fo (QA, the first electron acceptor of PSII is fully oxidazed); • of a saturating flash (8000 mmol m-2 s-1 for 1 s) is applied and the maximum value of chlorophyll fluorescence is measured, Fm (QA, the first electron acceptor of PSII is fully reduced); • constant illumination with actinic light produces a transient rise in fluorescence yield, due to the lag phase before carbon fixation (some carbon fixing enzymes are requiring light-activation); next upon the onset of photochemical and heat dissipation processes, fluorescence yield is quenched and reaches a steady state value Ft; • second saturation flash in the presence of actinic light, produces the maximum fluorescence under actinic light, Fm’.
Thus, there were measured 4 parameters: • Fm - maximum value of the chlorophyll fluorescence on the dark adapted leaf (QA- fully reduced); • Fo– minimum value of the chlorophyll fluorescence on the dark adapted leaf (QA - fully oxidized); • Fm’ -maximum value of the chlorophyll fluorescence on the light adapted leaf (QA- fully reduced); • Ft - minimum value of the chlorophyll fluorescence on the light adapted leaf (QA - fully oxidized); • Fm > Fm’ ; Ft > Fo • All for parameters give information about the fractions of light energy used for photosynthesis and for heat dissipation, respectively. • (Fm’ - Ft) indicates the photochemical part of fluorescence quenching • (Fm - Fm’) indicates the heat dissipation part of fluorescence quenching
The following computed parameters reflect some information about process occurring in the plant leaf: • Photochemical quenching: • qP = (Fm’-Ft)/(Fm’-Fo)] • indicates the redox state of the primary electron acceptor of PSII QA. • 2. Non-photochemical quenching: • qN = (Fm-Fm’)/(Fm-Fo) or NPQ = (Fm-Fm’)/Fm’] • indicates the energy dissipated as heat related to energization of the thylakoid membrane due to lumen acidification. • 3. Quantum yield of electron transfer at PSII (FPSII): • Y(II) = (Fm’-Ft)/Fm’ • indicates the overall efficiency of PSII reaction centers in the light. • 4. Ratio Fv’/Fm’ = (Fm’-Fo)/Fm’ • indicates the efficiency of open reaction centers in light • Some other parameters may be computed to learn more about stress factors on the energetic of leaf processes as happened when fertilizers or other chemicals are applied on the foliar way.
In this paper, for the evaluation of the foliar nutritive products effect on leaf photosynthesis process, there were used 2 parameters: A. Fv/Fm = (Fm - Fo)/Fm which is the maximum potential quantum efficiency of Photosystem II (PSII) . B. Y(II) = (Fm’-Ft)/Fm’ which is measuring the magnitude of effective quantum photosynthesis yield under steady-state photosynthetic lighting conditions. C. half-rise time of FM (T1/2) which gives information about the effects of environmental stressfactors on the photochemical reactions rate.
Last generation of fluorimeters provides much more complex measurement. OJIP protocol involves the same parameters described above, but the measurements are made by successive saturation flashes at for levels of excitation with frequency modulated light at variable intensity. This protocol allows computation of at least 30 parameters describing qualitatively and quantitatively the yields of chlorophyll fluorescence. The raise in electron transport per reaction centre ET0 / RC = M0 . (1 / VJ) . Phi_0) which quantifies the flux of electrons beyond QA (see PS I) during the initial fluorescence rise after actinic light impulse, was the choice for describing the effects of the emulsified nutritive fluids. M0 = 4 (F300 - F0) / (FM - F0) VJ=(FJ - F0) / (FM - F0) Phi_0 = 1 - VJ
EXPERIMENTAL SET UP • Foliar nutritive fluids • Emulsified foliar nutritive fluids transporting to the foliage surface: • variable NPK macronutrient formulas overcharged with mezzo nutrients: (Nutrinaft A); • growth enhancers (Nutrinaft B); • micronutrients (Amokem); • fungicides (Frucol). • These fluids are hydrolyzing through dilution and carbonation, leaving on the leaf surface a freshly precipitated layer of new biological active moieties. • Chitu, V., Chitu, E. Nicolae, S., Ionita A. D., M. Cirjaliu-Murgea, Filipescu L. (2009). Relationships between shelf life, health and quality of apple fruit. Acta Hort. (ISHS) 825:539-546; Cirjaliu-Murgea, M., Ionita, A. D. Chitu, E. Chitu V., Filipescu L. (2008). Emulsified nutritive fluids and their proprieties control. 6th International ISHS Symposium on Mineral Nutrition, Faro, Portugal.
Foliar application. Before application the foliar nutritive sample were diluted with hard water up to 1.0% mass concentration and applied in the first part of the day using a low pressure sprayer. Experimental plots were set on 5 variants for each apple cultivar: V1 – untreated blank plot, just spread with water at the same rate and at the same time intervals as the rest of foliar treated plots; V2 – foliar treated plot with the nutritive fluid Nutrinaft A; V3 – foliar treated plot with the nutritive fluid Nutrinaft B; V4 – foliar treated plot with the nutritive fluid Amochem dual B; V5 – foliar treated plot with the nutritive fluid Frucol. Chlorophyll fluorescence measurements 2007 –Chlorophyll fluorescence data were collected with an OS 30 (Opti-Sciences) chlorophyll fluorometer. 2009 – Chlorophyll fluorescence data acquisition was made with portable FluorPen FP 100 chlorophyll fluorometer (Photos Systems Instruments).
EXPERIMENTAL RESULTS Parameter A: Fv/Fm = (Fm - Fo)/Fm which is the maximum potential quantum efficiency of Photosystem II (PSII) Fig. 4. Variation of the FV/FM indicator versus the time elapsed since foliar application of the new emulsified nutritive fluids.
FV/FM ratio mean value of this indicator was found to be 0.755, very close to optimal accepted figure (0.830). Even if FV/FM correlates negatively with F0 (r= -0.877**) and FM (r= -0.249**), the experimental data point out to a low level of stress, induced by all the emulsified nutritive fluids. • Figure 4 clearly unveil certain significant jumps in FV/FM indicator values immediately in hours after application on the foliage for all the products. This behavior might be explained by fast penetration of nutritive and growth enhancing fluids through cuticula, and excedentary energy comsumption during this short period of overfeeding. After some 24-48 hours, this unharmful transitory overfeeding stress settles down to common potential quantum efficiency of Photosystem II (0.750-0.800), reflecting the safety health state of foliage. • FV/FM ratio, or the maximum potential quantum efficiency of Photosystem II (PSII), finely correlates with carbon fixation under any of circumstantial conditions (Schreiber et al., 1986; Baker & Rosenkuist, 2004).
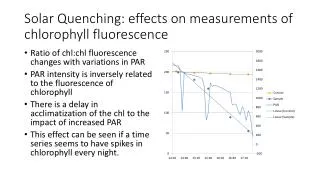
Parameter B: Y(II) = (Fm’-Ft)/Fm’, which is measuring the magnitude of effective quantum photosynthesis yield under steady-state photosynthetic lighting conditions. Figure 5. Variation of yield Y(II) versus the time elapsed since foliar application of the new emulsified nutritive fluids
Closure of reaction centers and heat dissipation are non-quenching energy consumers and share with yield Y(II) the total potential quantum efficiency FV/FM. Yield Y(II) low values (average mean 0.310) recorded during run tests for emulsified nutritive fluids under experimental conditions should be explained just in terms of comparison with the blank (figure 2). Significant fluctuation in yield Y(II) are taking place first 24 hours, as in figure 4. Afterwards the yield Y(II) value come back to those of normal blank ones. These observations sustain non quenching energy consumption for nutritive moieties transport under leaf overfeeding in first hours after emulsified nutritive fluids application. All the products do not impair the yield of light energy conversion into quenching energy.
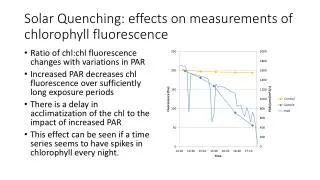
Parameter D:OJIP chlorophyll parameter ET0/RC, which quantifies the flux of electrons beyond QA (PS I) can be seen in the figure 6. Figure 6. Variation of the ET0/RC parameter over three day treatment with emulsified nutritive fluids
The raise in electron transport per reaction centre (expressed by ET0/RC level) is significant for all the treatments This raise is continual for all the products till the second day after application. Slight decrease in the third day is factually evidencing the active components have been adsorbed and consummated in the metabolic process. Thus, the nutrients consumption was not occurring on the spot, but metabolized at a rate controlled by the specific plant nutrition mechanism. Also the overfeeding and leaf burning under excessive foliar nutritive products could not come about with the frequency met to the common NPK foliar fertilizers. All the above data back up the formulation principles of emulsified nutritive fluids and sustain their capacity to promote growth stimulation and alleviate mineral stress at the foliage surface. Chitu, V., E. Chitu, A. Hororoi, M. Calogrea, M. Cirjaliu-Murgea and L. Filipescu (2004). Researches concerning Nutrinaft products effects on apple production and fruit quality, Annals of the University of Craiova, Vol. IX (XLV):123-128.
CONCLUSIONS • In dark adapted test the measured FV/FM ratio, standing for the maximum potential quantum efficiency of Photosystem II (PSII), experimental data point out to a low level of stress induced by all the emulsified nutritive fluids; • In the light adapted leaves the fluorescence indicator yield (Y(II), which is measuring the magnitude of effective quantum photosynthesis yield under steady-state photosynthetic lighting conditions, did take uncommon low values around the average mean of 0.310. Because the light reaction centers remained open and potential quantum efficiency Fv/Fm was normal (around 0.755 averaged mean), it is reasonable to consider the yield Y(II) was low due to the non quenching energy consumers (nutrient transport through cuticula); • The ET0/RC chlorophyll fluorescence parameter (measured under mild environmental stress), which quantifies the flux of electrons beyond QA during the initial fluorescence rise after saturated light impulse, was found significantly increasing for all the emulsified nutritive fluids applied as diluted solutions. Its slight decrease in the third day is factually evidencing the active components carried by the emulsified nutritive fluids have been adsorbed, and consummated in the metabolic process at a rate controlled by the specific plant nutrition mechanism; • All the above data back up the formulation principles of emulsified nutritive fluids and acknowledge these products capacity to promote growth stimulation and alleviate mineral stress at the foliage surface.
MULTUMESC ! ACKNOWLEDGMENT: The work was carried out with the financial support of the CNCSIS Program, ‘Ideas’, within the Research Project 1035/2007.