Download
1 / 1
10 likes | 137 Vues
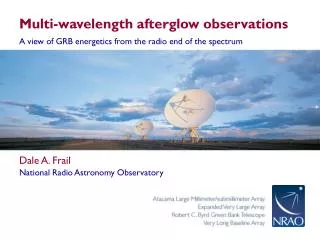
Sky. Optical Analyzer/Detector. 355 532 1064. Telescope. Laser Nd:YAG. Dichroic mirrors. Multi-Wavelength LIDAR Observing Aloft Aerosol Plumes in NYC Shifali Reddy, Dr. Yonghua Wu, Dr. Fred Moshary

E N D
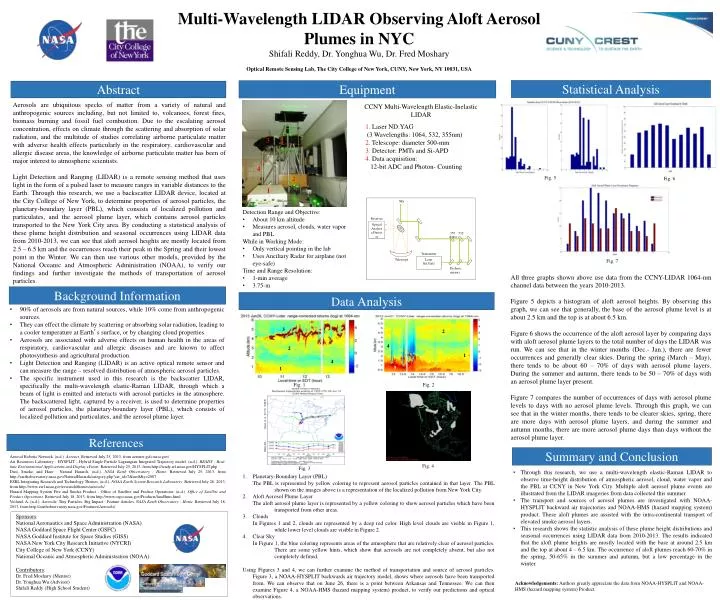
Sky Optical Analyzer/Detector 355 532 1064 Telescope Laser Nd:YAG Dichroic mirrors Multi-Wavelength LIDAR Observing Aloft Aerosol Plumes in NYC Shifali Reddy, Dr. Yonghua Wu, Dr. Fred Moshary Optical Remote Sensing Lab, The City College of New York, CUNY, New York, NY 10031, USA Receiver 3 4 Transmitter 2 Statistical Analysis Equipment Abstract 1 CCNY Multi-Wavelength Elastic-Inelastic LIDAR Aerosols are ubiquitous specks of matter from a variety of natural and anthropogenic sources including, but not limited to, volcanoes, forest fires, biomass burning and fossil fuel combustion. Due to the escalating aerosol concentration, effects on climate through the scattering and absorption of solar radiation, and the multitude of studies correlating airborne particulate matter with adverse health effects particularly in the respiratory, cardiovascular and allergic disease areas, the knowledge of airborne particulate matter has been of major interest to atmospheric scientists. Light Detection and Ranging (LIDAR) is a remote sensing method that uses light in the form of a pulsed laser to measure ranges in variable distances to the Earth. Through this research, we use a backscatter LIDAR device, located at the City College of New York, to determine properties of aerosol particles, the planetary-boundary layer (PBL), which consists of localized pollution and particulates, and the aerosol plume layer, which contains aerosol particles transported to the New York City area. By conducting a statistical analysis of these plume height distribution and seasonal occurrences using LIDAR data from 2010-2013, we can see that aloft aerosol heights are mostly located from 2.5 – 6.5 km and the occurrences reach their peak in the Spring and their lowest point in the Winter. We can then use various other models, provided by the National Oceanic and Atmospheric Administration (NOAA), to verify our findings and further investigate the methods of transportation of aerosol particles. 1. Laser ND:YAG (3 Wavelengths: 1064, 532, 355nm) 2. Telescope: diameter 500-mm 3. Detector: PMTs and Si-APD 4. Data acquisition: 12-bit ADC and Photon- Counting Fig. 5 Fig. 6 • Detection Range and Objective: • About 10 km altitude • Measures aerosol, clouds, water vapor and PBL • While in Working Mode: • Only vertical pointing in the lab • Uses Anciliary Radar for airplane (not eye-safe) • Time and Range Resolution: • 1-min average • 3.75-m Fig. 7 All three graphs shown above use data from the CCNY-LIDAR 1064-nm channel data between the years 2010-2013. Figure 5 depicts a histogram of aloft aerosol heights. By observing this graph, we can see that generally, the base of the aerosol plume level is at about 2.5 km and the top is at about 6.5 km. Figure 6 shows the occurrence of the aloft aerosol layer by comparing days with aloft aerosol plume layers to the total number of days the LIDAR was run. We can see that in the winter months (Dec.- Jan.), there are fewer occurrences and generally clear skies. During the spring (March – May), there tends to be about 60 – 70% of days with aerosol plume layers. During the summer and autumn, there tends to be 50 – 70% of days with an aerosol plume layer present. Figure 7 compares the number of occurrences of days with aerosol plume levels to days with no aerosol plume levels. Through this graph, we can see that in the winter months, there tends to be clearer skies, spring, there are more days with aerosol plume layers, and during the summer and autumn months, there are more aerosol plume days than days without the aerosol plume layer. Background Information Data Analysis • 90% of aerosols are from natural sources, while 10% come from anthropogenic sources. • They can effect the climate by scattering or absorbing solar radiation, leading to a cooler temperature at Earth’s surface, or by changing cloud properties. • Aerosols are associated with adverse effects on human health in the areas of respiratory, cardiovascular and allergic diseases and are known to affect photosynthesis and agricultural production. • Light Detection and Ranging (LIDAR) is an active optical remote sensor and can measure the range – resolved distribution of atmospheric aerosol particles. • The specific instrument used in this research is the backscatter LIDAR, specifically the multi-wavelength elastic-Raman LIDAR, through which a beam of light is emitted and interacts with aerosol particles in the atmosphere. The backscattered light, captured by a receiver, is used to determine properties of aerosol particles, the planetary-boundary layer (PBL), which consists of localized pollution and particulates, and the aerosol plume layer. 3 2 4 2 1 4 3 1 Fig. 1 Fig. 2 References Summary and Conclusion Aerosol Robotic Network. (n.d.). Aeronet. Retrieved July 25, 2013, from aeronet.gsfc.nasa.gov/ Air Resources Laboratory - HYSPLIT - Hybrid Single Particle Lagrangian Integrated Trajectory model. (n.d.). READY - Real-time Environmental Applications and Display sYstem. Retrieved July 25, 2013, from http://ready.arl.noaa.gov/HYSPLIT.php Dust, Smoke, and Haze : Natural Hazards. (n.d.). NASA Earth Observatory : Home. Retrieved July 25, 2013, from http://earthobservatory.nasa.gov/NaturalHazards/category.php?cat_id=7&m=8&y=2007 ESRL Integrating Research and Technology Themes. (n.d.). NOAA Earth System Research Laboratory. Retrieved July 26, 2013, from http://www.esrl.noaa.gov/research/themes/aerosols/ Hazard Mapping System Fire and Smoke Product - Office of Satellite and Product Operations. (n.d.). Office of Satellite and Product Operations. Retrieved July 18, 2013, from http://www.ospo.noaa.gov/Products/land/hms.html Voiland, A. (n.d.). Aerosols: Tiny Particles, Big Impact : Feature Articles. NASA Earth Observatory : Home. Retrieved July 18, 2013, from http://earthobservatory.nasa.gov/Features/Aerosols/ Fig. 4 Fig. 3 • Through this research, we use a multi-wavelength elastic-Raman LIDAR to observe time-height distribution of atmospheric aerosol, cloud, water vapor and the PBL at CCNY in New York City. Multiple aloft aerosol plume events are illustrated from the LIDAR imageries from data collected this summer. • The transport and sources of aerosol plumes are investigated with NOAA-HYSPLIT backward air trajectories and NOAA-HMS (hazard mapping system) product. These aloft plumes are assisted with the intra-continental transport of elevated smoke aerosol layers. • This research shows the statistic analysis of these plume height distributions and seasonal occurrences using LIDAR data from 2010-2013. The results indicated that the aloft plume heights are mostly located with the base at around 2.5 km and the top at about 4 – 6.5 km. The occurrence of aloft plumes reach 60-70% in the spring, 50-65% in the summer and autumn, but a low percentage in the winter. • Planetary-Boundary Layer (PBL) • The PBL is represented by yellow coloring to represent aerosol particles contained in that layer. The PBL shown on the images above is a representation of the localized pollution from New York City. • Aloft Aerosol Plume Layer • The aloft aerosol plume layer is represented by a yellow coloring to show aerosol particles which have been transported from other areas. • Clouds • In Figures 1 and 2, clouds are represented by a deep red color. High level clouds are visible in Figure 1, while lower level clouds are visible in Figure 2. • Clear Sky • In Figure 1, the blue coloring represents areas of the atmosphere that are relatively clear of aerosol particles. There are some yellow hints, which show that aerosols are not completely absent, but also not completely defined. • Using Figures 3 and 4, we can further examine the method of transportation and source of aerosol particles. Figure 3, a NOAA-HYSPLIT backwards air trajectory model, shows where aerosols have been transported from. We can observe that on June 26, there is a point between Arkansas and Tennessee. We can then examine Figure 4, a NOAA-HMS (hazard mapping system) product, to verify our predictions and optical observations. Sponsors: National Aeronautics and Space Administration (NASA) NASA Goddard Space Flight Center (GSFC) NASA Goddard Institute for Space Studies (GISS) NASA New York City Research Initiative (NYCRI) City College of New York (CCNY) National Oceanic and Atmospheric Administration (NOAA) Contributors: Dr. Fred Moshary (Mentor) Dr. Yonghua Wu (Advisor) Shifali Reddy (High School Student) Acknowledgements: Authors greatly appreciate the data from NOAA-HYSPLIT and NOAA-HMS (hazard mapping system) Product.