Download
1 / 20
200 likes | 304 Vues
Environmental Hydrology Team Meeting. Show how the Alliance has demonstratably changed the nation’s computational infrastructure Show explicitly how we have empowered communities to do things better Focus on deployment of infrastructure

E N D
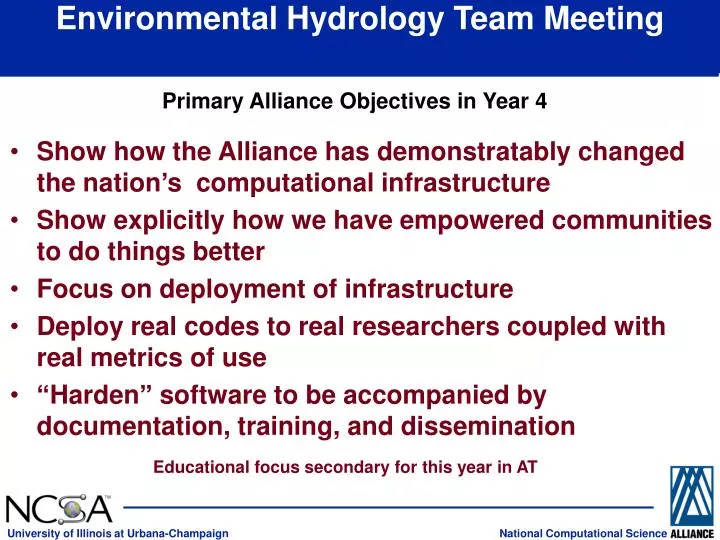
Environmental Hydrology Team Meeting • Show how the Alliance has demonstratably changed the nation’s computational infrastructure • Show explicitly how we have empowered communities to do things better • Focus on deployment of infrastructure • Deploy real codes to real researchers coupled with real metrics of use • “Harden” software to be accompanied by documentation, training, and dissemination Primary Alliance Objectives in Year 4 Educational focus secondary for this year in AT
Purpose of Workshop 1) Learn about the current status of EH projects • Develop overall team goals for this year in light of Alliance goals • Refine SOW’s in light of team goals • Determine current and future AT and/or EH team collaboration • Define expected deliverables this year both dependence and independent of EH development • Identify what is holding us back from reaching our individual and group goals • Discuss communication and reporting • Plan group PR • Other ?????
Presentation Guidelines 1) Briefly summarize past accomplishments and deliverables with at most 3 to 4 bullets on 1 or 2 overheads2) State your main goals and deliverables (and your groups specific contributions to these them) for this year. I would like at most 4 bullets here.3) What communities will you actually impact this year and how will this be accomplished (include plans for disseminating software or interacting with communities who will benefit from your work)4) Note who on your team will actually carry out the work and what percentage of time they will be contributing5) Note your questions/concerns about realizing the goals and deliverables (e.g., looking for a student to work on this, work can't begin until January due to other commitments, when will a linux cluster be available for me to work on,........)
Schedule 8:30 Alliance Directions Dick Crutcher – Alliance Chief Scientist 9:00 Purpose/Goals of the Workshop Bob Wilhelmson – EH Team Lead 9:15 VisAD and Coupling Bill Hibbard – U. of Wisconsin 9:45 SME Developments Tom Maxwell – U. of Maryland 10:15 ARPS Development Dan Weber – U. of Oklahoma 10:45 Infrastructure and Benchmarking Danesh Tafti - NCSA 11:15 Hydrologic Developments Frank Weirich – U. of Iowa 11:45 Surface Modeling Baxter Vieux – U. of Oklahoma 12:15 Lunch and demo setup 12:30 Digital River Basin Doug Johnston – NCSA 1:00 Demoes 2:00 Portal Development Jay Alameda – Alliance Chemistry Team 2:30 Regional Ocean Modeling Dale Haidvogel – Rutgers U. 3:00 Visualization of Fluids Polly Baker – NCSA, Dir. Data Mining/Vis. 3:30 OPIE Doug Fine – NCSA 4:00 Clusters at NCSA Rob Pennington – NCSA, Acting Dir. C&C 4:30 HDF5 Developments Mike Folk – NCSA 5:00 General Discussion Bob Wilhelmson 7:00 Dinner at Silvercreek
Alliance Technology Roadmap Science Portals & Workbenches P e r f o r m a n c e Twenty-First Century Applications Access Grid Computational Grid Access Services & Technology Computational Services Grid Services (resource independent) Grid Fabric (resource dependent) Networking, Devices and Systems • Capability computing • attack complex problems • move from rationing to computing on demand • Building the Grid • eliminate distance for virtual teams • convert computing into a utility • Science portals • bring commercial web technology to scientists • build electronic research communities • Clusters as the unifying mechanism • User wants and review recommendations
Linux Terascale Cluster (a) Terascale Architecture Overview (b) Example 320-node Clos Network Spine Switches Clos mesh Interconnect Each line = 8 x 2Gb/s links 128-port Clos Switches 64 hosts 64 hosts 64 hosts 64 hosts 64 hosts Add’l Clusters, External Networks 64 inter-switch links 64 inter-switch links 64 inter-switch links = 4 links 64 TB RAID Local Display Networks for Remote Display 100Mb/s Switched Ethernet Management Network (c) I/O - Storage (d) Visualization (e) Compute 32 IA-32 32 IA-32 782 IA-64
Linking People and Resources Sensor Arrays
Prototypical Grid Applications • NSF Network for Earthquake Engineering Simulation (NEES) – Tom Prudhomme • integrated instrumentation, collaboration, simulation • planning study for $10M deployment • Grid Physics Network (GriPhyN) – Ian Foster • largest NSF ITR award • ATLAS, CMS, LIGO, SDSS • distributed analysis of petascale data • Environmental modeling • Mobile, disposable sensors and wireless networks • Integrated measurement, simulation, and adaptation • EH atmosphere, land, ocean, and ecosystem modeling GriPhyN Physics Grid Network NSF NEES Earthquake Grid
Collaborative Technologies • Access Grid does for people what the Computational Grid does for machines • enables group interaction with the Grid • streaming multicast audio/video and shared presentations PC Options: Alliance Access Grid Netmeeting New voice/video technology coupled with large screen TV or flat screen
“Standard” Portal Model Users Browser Other Desktop Tools Users Desktop machine MyProxy certificate server Portal Server file Services Authentication Service Job mgmt Service Info Services security Services COG/GPDK The Grid - remote compute, data and application resources
Grand Challenges in Environmental SciencesNew NRC Report requested by NSF • Biogeochemical Cycles • Biological Diversity and Ecosystem Functioning • Climate Variability • Hydrologic Forecasting • Infectious Disease and the Environment • Institutions and Resource Use • Land-Use Dynamics • Reinventing the Use of Materials Recommended for immediate research investment
Weather Research/Forecasting Model Wilhelmson Objectives for 2001 • Adding HDF5 parallel I/O capabilities • Porting/optimizing for IA32 and IA64 clusters • Deployment/documentation of these added capabilities • Woodward collaboration to improve performance for very large problems on hundreds of processors Staff Wilhelmson 25% Shaw 30% • Usage and Dissemination • WRF beta release in November 2000 • Updates during year Issues Shaw on leave Group Objectives in grid enabled environment • Couple with VisAD • Couple with surface model • Develop portal interface
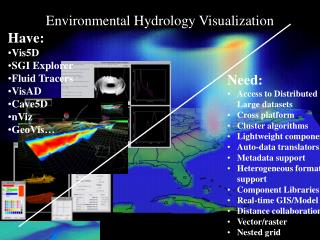
Environmental Hydrology Visualization • Options: • Vis5D • SGI Explorer • Fluid Tracers • VisAD • Cave5D • nViz • GeoVis… • VisBench • NCAR Graphics • IBM Data Explorer • IDL • Need: • Access to distributed large datasets • Cross platform • Cluster algorithms • Lightweight component • Auto-data translators • Metadata support • Heterogeneous format support • Component libraries • Real-time GIS/Model • Distance collaboration • Vector/raster • Nested grid
VisBench and Geospatial Data Early results for combining Terrain plus GIS info plus simulation output Visualization generator Terrain/GIS Server(s) Client application Rob Stein
Graphics: How Far We’ve Come • Toy Story™ • 2-12 million triangles/frame • in 2001 we will be close to Toy Story graphics • in real time on PCs • "Reality" • 80 million triangles/frame • within 5-10 years a PC game • will be on par with "reality“ • Playstation2 story (stay tuned …)
Computing On Toys • Sony PlayStation2 features • 6.2 GF peak • 70M polygons/second • 10.5M transistors • superscalar RISC core • plus vector units, each: • 19 mul-adds & 1 divide • each 7 cycles • $299 suggested retail • U.S. release October 2000 • 980,000 units sold first week in Japan • Terascale computing • $60K/teraflop • scalable visualization
The New Quadrangle • $110M IT infrastructure • the world’s best • living laboratories • North research park • three stage R&D pipeline • basic research • prototyping • transfer and development • industrial partners nearby