Download
1 / 12
180 likes | 628 Vues
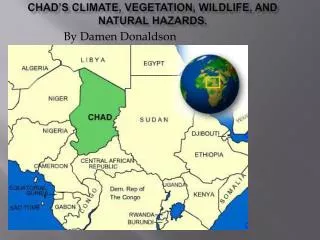
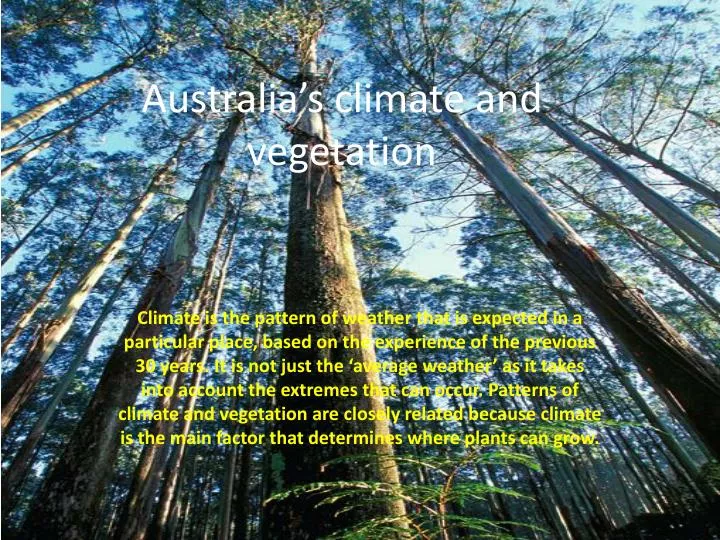
Australia’s climate and vegetation. Climate is the pattern of weather that is expected in a particular place, based on the experience of the previous 30 years. It is not just the ‘average weather’ as it takes into account the extremes that can occur. Patterns of

E N D
Australia’s climate and vegetation Climate is the pattern of weather that is expected in a particular place, based on the experience of the previous 30 years. It is not just the ‘average weather’ as it takes into account the extremes that can occur. Patterns of climate and vegetation are closely related because climate is the main factor that determines where plants can grow.
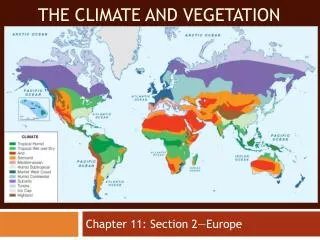
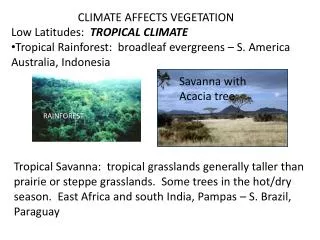
Australia’s pattern ofclimate • Australia has a wide range of climates due to its locationand extent. About 40 per cent of the continent lies withinthe tropics—the zone between the Equator and the Tropicof Capricorn—where it is warm all year round and thereare only two seasons—wet and dry. The remainder of thecountry lies in the temperate zone and experiences fourseasons—spring, summer, autumn and winter—each with its own distinctive weather patterns.
Factors influencing Australia’s climate One of the most distinctive features of the Australianclimate is its variability. There are a range of factors thatinfluence climate and are responsible for the changes thatoccur from region to region and from year to year. • Latitude—The Earth receives more of the Sun’s energyat the Equator than at the poles so temperaturesare highest at the Equator and decrease as latitudeincreases. • Distance from the coast—The sea has a moderatingeffect so temperature ranges are less at the coast thaninland. Onshore winds bring higher precipitation tocoastal areas. • Ocean currents—Currents from nearer the poles bringcooler conditions and those from nearer the Equatorbring warmer conditions. • Direction of prevailing winds—Winds from nearer theEquator are warmer than those from nearer the poles.Winds from over the ocean bring precipitation andthose from inland are dry.
• Relief—Temperature decreases with height. Moist airthat is forced to rise by mountains cools, and the watervapour condenses, producing increased cloud coverand precipitation. Highland areas are cooler and wetterthan lowland areas. • Pressure systems—High pressure associated withsinking air brings dry settled weather. Low pressurecaused by rising air brings unsettled weather. Australiais dominated by high pressure with low pressure in thenorth during summer and in the south during winter. • El Niño—The normal circulation pattern in the PacificOcean brings rain to Australia. In an El Niño year thecirculation reverses and South America receives therain while Australia remains dry.
Climate graphs Climate graphs show the average temperature and rainfallfor a given place over a 12-month period. They are usedby geographers to study spatial patterns of climate andthe relationships between temperature and rainfall.Each graph is composed of a column graph showingthe precipitation and either one line graph showing theaverage temperature or two line graphs, one showing theaverage maximum temperature and the other showing the average minimum temperature.
Activity • Go to the site below and complete the Activities • http://www.bom.gov.au Activities • Go to climate information and then Climate data online • Choose either temp or rainfall • Choose an area • Choose a station • Click get data • On the spreadsheet go to the little chart icon in the last column of the spread sheet • Use this information to create a climate graph
Pressure patterns • http://www.seabreeze.com.au/info/wind.asp • Cut out pictures for worksheet and paste them in your book and then using the website above describe each pressure system