Download
1 / 3

E N D
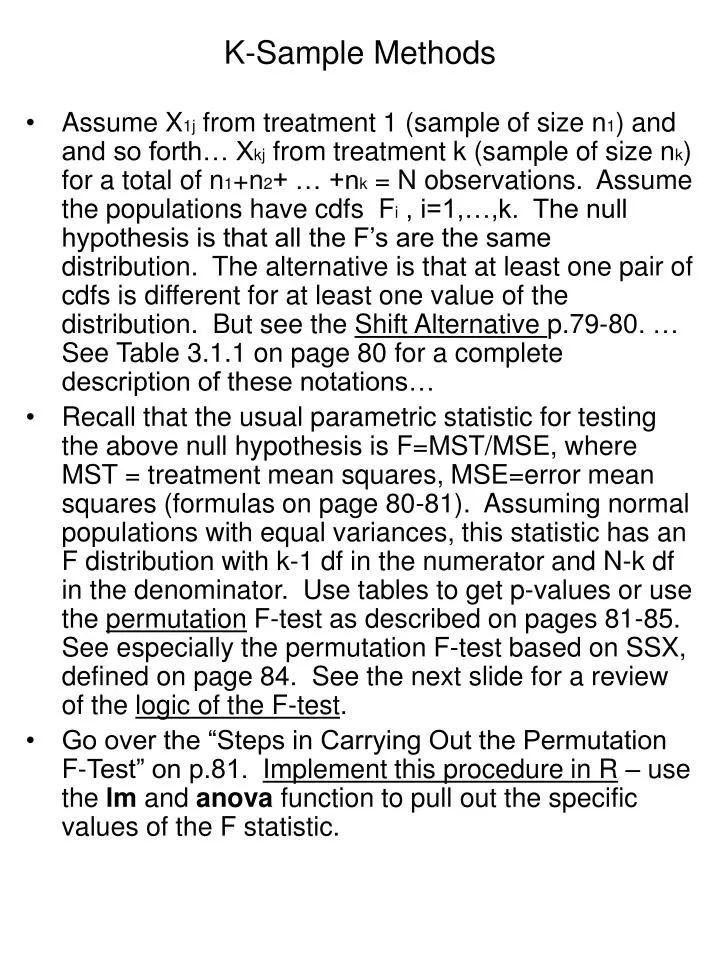
K-Sample Methods • Assume X1j from treatment 1 (sample of size n1) and and so forth… Xkj from treatment k (sample of size nk) for a total of n1+n2+ … +nk = N observations. Assume the populations have cdfs Fi , i=1,…,k. The null hypothesis is that all the F’s are the same distribution. The alternative is that at least one pair of cdfs is different for at least one value of the distribution. But see the Shift Alternative p.79-80. … See Table 3.1.1 on page 80 for a complete description of these notations… • Recall that the usual parametric statistic for testing the above null hypothesis is F=MST/MSE, where MST = treatment mean squares, MSE=error mean squares (formulas on page 80-81). Assuming normal populations with equal variances, this statistic has an F distribution with k-1 df in the numerator and N-k df in the denominator. Use tables to get p-values or use the permutation F-test as described on pages 81-85. See especially the permutation F-test based on SSX, defined on page 84. See the next slide for a review of the logic of the F-test. • Go over the “Steps in Carrying Out the Permutation F-Test” on p.81. Implement this procedure in R – use the lm and anova function to pull out the specific values of the F statistic.
1. MSE is an estimate of the population variance based on the deviation of scores around their respective treatment means. It is a weighted average of the treatment variances (see p.80) 2. MST is also an estimate of the population variance if the null hypothesis is true. It is based upon the deviations of group means about the grand mean. Since it is influenced by treatment effects, it is only an estimate of the same population variance if the treatment effects are zero; i.e., when the null hypothesis is true. 3. It turns out that if the null hypothesis is true, the ratio of these two variance estimates is distributed as an F-distribution: F = MST / MSE 4. Since under the null hypothesis the two mean squares are estimating the same population value, this ratio should be close to 1 when the null is true. The observed value of F is compared to the sampling distribution of F to get a p-value (or empirical p-value via permutation test) to look for departures from the null hypothesis. 5. If the observed F ratio is "large", then perhaps the assumption of the null hypothesis of no treatment effect is false, and we should reject the null.
See section 3.1.3 on p. 83 for an alternative statistic to use for the permutation test – the author calls it SSX where • The use of SSX in place of F is justified in permutation tests of this type… • HW for Thursday: Read section 3.1 and 3.2 about the Kruskal-Wallis test… Do problem #2 on page 105 – include the use of the Kruskal – Wallis test on this data. Write up a solution and hand it in as part of the mid-term exam. This will be the last question on the take-home part of the midterm.