Download
1 / 26
260 likes | 399 Vues
Advanced Lectures on Galaxies (2008 INAOE): Chapter 4. Evolutionary Population Synthesis models. Divakara Mayya INAOE http://www.inaoep.mx/~ydm. What do we try to synthesize?. Observed quantities (spectrum, colors, Luminosity etc.) from a region of a galaxy which consists of

E N D
Advanced Lectures on Galaxies (2008 INAOE): Chapter 4 Evolutionary Population Synthesis models Divakara Mayya INAOE http://www.inaoep.mx/~ydm
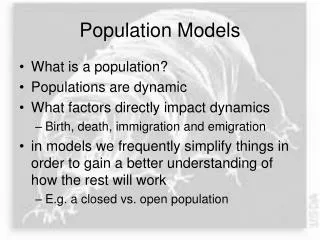
What do we try to synthesize? Observed quantities (spectrum, colors, Luminosity etc.) from a region of a galaxy which consists of Stars: emit light Dust : absorb and re-radiate Gas : ionize and re-radiate In general the three components are mixed even for parsec size regions such as the Super Star Cluster R136. Mayya
What do we try to synthesize? The aim is to obtain the ages and masses of all important stellar groups the in a given region, by comparing the observed quantities with the theoretically computed quantities. The region in study may be as simple as an old globular cluster (GC) or as complex as a starburst in an interacting galaxy such as the Antennae. GCs are relatively simple --- all the stars are of the same age, hardly any gas and dust Starburst systems are complex --- - Age spread - Metallicity spread - In-homogenous dust distribution - Underlying background Mayya
The Simplest modelSimple Stellar Populations (SSP)or Instantaneous Bursts (IB) Stars: Total Stellar Flux = Number of living stars * Flux of each star - all the living stars have the same age and metallicity - mass distribution is power-law (Salpeter IMF) Dust: Correct the observed fluxes using a derived extinction assuming foreground dust model and an extinction curve (Cardelli et al. 1989) Gas: Add the fluxes calculated from photo-ionization models for an HII region to the synthesized stellar fluxes (Osterbrock’s text)
SSP: Basic equations and Ingredients Stellar Evolutionary tracks (Isochrones) - Geneva - Padova • Uncertainties: • Mass-loss rates? • Rotation? Stellar Atmospheric models - Kurucz (LTE) models - Observed stellar spectra • Uncertainties: • non-LTE effects? • Hot star models Mayya
SSP: The method Isochrone Interpolation schemes Mayya
SSP: The method Effect of rotation: rotating (_____) non-rotating (---) Mayya
SSP: The output 1. Nebular Lines 2. Continuum band luminosity Mayya
SSP: The output 3. Colors and equivalent widths - U-B, B-V, V-K etc. - EW(Ha), EW(Hb) etc. 4. Selected spectral features - CaT from RSGs - Broad 4686 from Wolf-Rayet 5. Radio continuum - Thermal flux from HII region - Non-thermal flux from SNRs 6. Far-infrared continuum in dusty galaxies - Bolometric luminosity 7. Mechanical energy - Power from stellar winds and SN explosions Mayya
(Class II) SSP: Results Discussion of the paper Sec. 3: Dependence of SSP evolution with input parameter, comparison with observations etc. Mayya
(Class III) SSP: observable phases • Nebular ( < 6 Myr) : Emission lines • Wolf-Rayet (3-5 Myr) : HeII 4686 broad spectral feature • Red Supergiant (7-20 Myr): Calcium Triplet in absorption • A-star (50-500 Myr) : Balmer lines in absorption • Intermediate (0.5-2 Gyr) : Balmer and CaII H and K line ratios • Old population (>2 Gyr): 4000 Ang break and other Lick indices Mayya
SSP: spectral evolution Mayya
Continuous Star formation (CSF) vs IB:Ionizing photons Mayya
CSF vs IB: Magnitude Mayya
CSF vs IB: colors Mayya
CSF vs IB: SED Mayya
Deriving Age and Mass: diagnostic diagrams 1. Color vs Color : age/extinction 2. Magnitude vs Color: age/extinction and mass 3. EW(Ha) vs Color : age and extinction 4. Spectral fitting : age and extinction 5. Lick Indices : age/metallicity Mayya
CSF vs IB: RSG features Mayya 1997 Mayya
The real case:star formation history of starburst nuclei Mayya
The real case: star formation history of starburst nuclei Mayya
Star formation history of M82 disk Mayya et al. (2006) Mayya
Other applications: SFR Kennicutt 1998 Mayya
Other applications: Galaxy formation and evolution • Fossil analysis (MOPED) • Integrated approach (GRASIL) Mayya