Download

1 / 16
160 likes | 355 Vues
Joint Nordic Test Day Model: Evaluation Model. M. Lidauer 1 , J. Pedersen 2 , J. Pösö 3 , E. A. Mäntysaari 1 , I. Strandén 1 , P. Madsen 4 , U.S. Nielsen 2 , J.-Å. Eriksson 5 , K. Johansson 5 , G.P. Aamand 6 1 MTT Agrifood Research Finland, 2 Danish Agricultural Advisory Service,

E N D
Joint Nordic Test Day Model:Evaluation Model M. Lidauer1, J. Pedersen2, J. Pösö3, E. A. Mäntysaari1, I. Strandén1, P. Madsen4, U.S. Nielsen2, J.-Å. Eriksson5, K. Johansson5, G.P. Aamand6 1MTT Agrifood Research Finland, 2Danish Agricultural Advisory Service, 3Faba Breeding, 4Danish Institute of Agricultural Sciences, Genetics and Biotechnology, 5Swedish Dairy Association 6NAV Nordic Cattle Genetic Evaluation
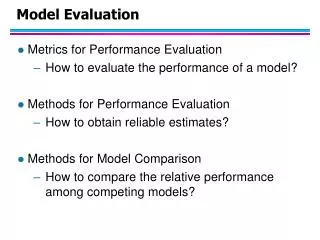
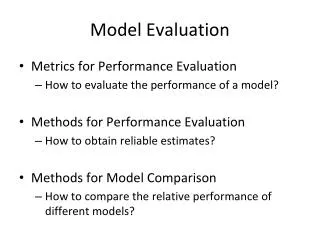
Aim Describing of the model • environmental effects • adjustment for heterogeneous variance
Data All dairy cattle from Denmark, Finland, & Sweden Holstein / Danish Friesian / Finnish Friesian / Swedish Friesian / Danish Red and White Orig. Red Danes / Finnish Ayrshire / Swedish Red / Brown Swiss / Red Holstein / Montebeliarde / Norwegian Red / Canadian Ayrshire / Finncattle Danish Jersey / Swedish Jersey / US Jersey / NZ Jersey
Model • Based on a meta-model approach • reduced rank, random regression • describing TD yields and 305d yields • different variance components across countries but: genetic correlation of 1.0 across countries • Multiple trait: milk, protein, fat • bimonthly measurements for protein and fat • Parities and countries are different traits 27 traits
Structure of the model Given for one biological trait (t) and type of data (Tc, L): random animal effects environmental effects
Effects (I) • Calving age • lin. + quad. regression on calving age additionally for Red Breed model: • lin. + quad. regression on calving age x breed proportion • for Brown Swiss and for Holstein in Danish traits • for Holstein and for Finncattle in Finnish traits
Effects (II) • Specific to lactation yield traits • calving year-month • regression on days open • preceding calving interval • Specific to test-day yield traits • test year-month • days carried calf • days dry • stage of lactation 2nd order Legendre polynomial + 2 Wilmink exp. terms nested within calving age x test-month x 4-year period
Effects (III) • Herd • fixed herd-year • random herd-test-day (fixed for Danish Holstein and Jersey) • fixed regression on days in milk (for TD-yield traits) nested within herd and 5-year period effects are considered to be the same in 2nd and 3rd parity
Effects (IV) • Heterosis • fixed regression on total sum of heterosis • modeled across countries • five random heterosis effects within each country • one for each of the most important five crosses • correlation structure between same heterosis effects across countries • Recombination loss • modeled as heterosis
Effects (V) • Random animal effects • additive genetic animal effects • 6 + 8 coefficients • none-genetic animal effects across parities • 6 + 6 + 6 coefficients • none-genetic animal effects within later parities • 6 coefficients for each parity from 3rd parity onwards
Heterogeneous variance adjustment • Simultaneous solving of evaluation model and variance-model (Meuwissen et al., 1996) • Effects in variance-model • country year month parity • random herd-year with autoregressive correlation between herd-years • Across-country standardization procedure • based on approx. re-estimation of genetic variances
Results: heterosis estimates Heterosis estimates for milk yield (in % of phenotypic mean) given for two important crosses.
Results: heterogeneous variance Re-estimated genetic standard deviation for NAV index (in kg), obtained from Red Breed sires.
Results: heterogeneous variance Re-estimated genetic standard for NAV milk index, obtained from Red Breed cows.
Results: breeding values Standard deviation of NAV milk index for Red Breed cows.
Conclusions • Across-country evaluation based on raw data is preferable over MACE • Complexity of the model bears own risks • sensitivity of across-country evaluation to modelling of cross breeding effects • across-country standardization of heterogeneous variance • Solving of these problems enabled official implementation of the Nordic yield model