Download
1 / 13
130 likes | 231 Vues
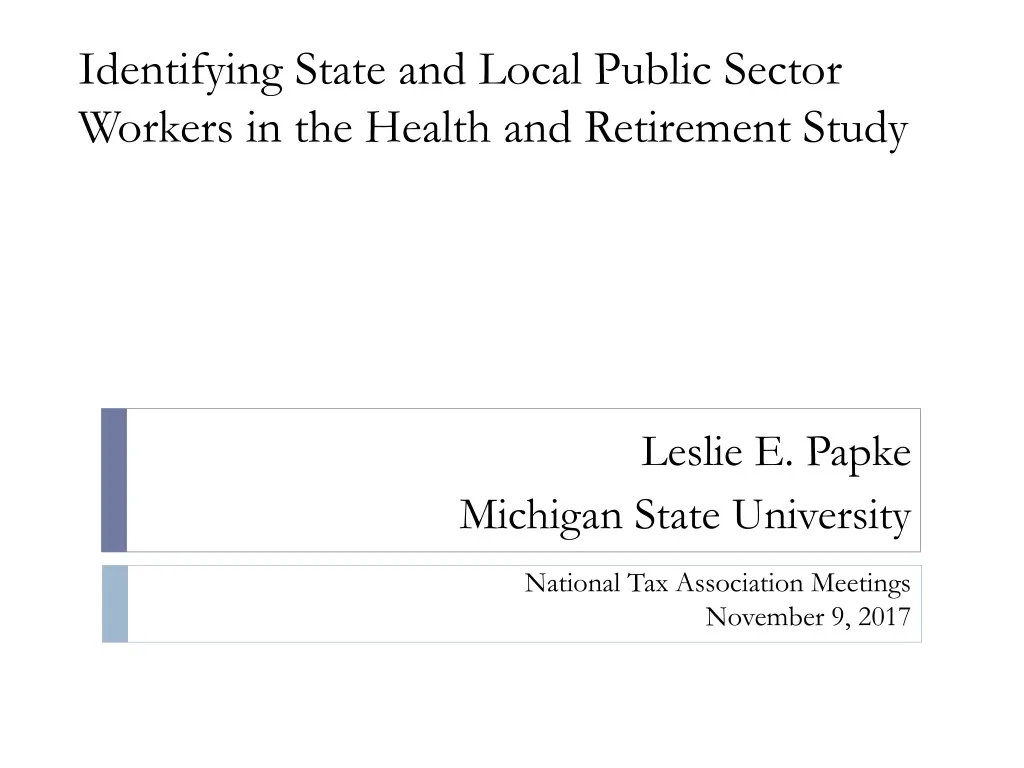
Identifying State and Local Public Sector Workers in the Health and Retirement Study. National Tax Association Meetings November 9 , 2017. Leslie E. Papke Michigan State University. Sustainability of state and local pension systems remains a major issue. Motivation.

E N D
Identifying State and Local Public Sector Workers in the Health and Retirement Study National Tax Association Meetings November 9, 2017 Leslie E. Papke Michigan State University
Sustainability of state and local pension systems remains a major issue Motivation Source: National Council on Teacher Quality (2015)
Motivation • State legislatures have reduced public sector pension generosity, but defined benefit plans remain the norm in public employment. • From 2009 to 2011, 43 states introduced changes in state plans for general employees and teachers to address long-term funding problems. • Examples include adjustments to contribution rates, benefit reductions, and changes to early retirement compensation rules. • Benefit reductions include an increase in the number of years until vesting, the number of years used in the FAS calculation, and reduction or elimination of inflation adjustments.
Example (NY): includes higher contribution rate, higher retirement age, increase in vesting to 10 years. Motivation Source: National Council on Teacher Quality (2012)
Motivation • My focus is on the behavioral effects of these pension parameters on the timing of retirement and re-employment following retirement from the public sector. • Ultimately, plan to estimate value placed on DB pension. Offer lump sum payment in exchange for annuity? (Fitzgerald, 2010; Papke, 2011) • Shortcomings of administrative data • There is much variation across states in pension plans for state/local employees, teachers, and public safety employees. • Over 5.25 million public employees do not participate in Social Security.
Health and Retirement Study • Most complete longitudinal survey of pre-retirement population – nationally representative of older population • Four cohorts enter at age 51-56 in 1992, 1998, 2004, and 2010 • Surveyed every two years. Active time for public pensions • Publicly available data: employment, income, assets, health, retirement, insurance, and family structure • Rand HRS data files (v. P), Rand-enhanced Fat Files (one per wave)
Health and Retirement Study • Restricted Data: • Geographic codes for state of residence to identify public pension plan parameters (Public Fund Survey) and state tax rates, other state level policy • Detailed industry and occupation codes to identify public sector job type (especially teachers) • Pension calculator and pension parameters from employer Summary Plan Descriptions. Calculates early retirement present value, peak present value
Identifying a public employee • Response to prompt at entry, 2006 and 2010 • Trace forward and backward using job length • Gustman, Steinmeier, and Tabatabai (2013) find substantial underreporting of public employment compared to report of lack of Social Security coverage • SS participation asked in 2004, also third wave for HRS • Trace this response • Detailed industry and occupation data • Identify teachers, public administrators, police and firefighters
Conclusions & Future Work • Have substantially increased public sector sample size in HRS and documented job changes – by about a third in entry year. • Next: • Study retirement decision as a function of pension peak value, Social Security coverage, and spousal characteristics • Estimate re-employment probabilities after retirement from public employment • Estimate wage/benefit tradeoff for employees with and without Social Security coverage