Download
1 / 21
210 likes | 407 Vues
i Tree: Exploring Time-Varying Data using Indexable Tree. Yi Gu and Chaoli Wang Michigan Technological University Presented at IEEE Pacific Visualization Symposium 28 February 2013 Sydney, Australia. Time-activity curve (TAC) Time-varying medical imaging data [Fang et al. 2007]

E N D
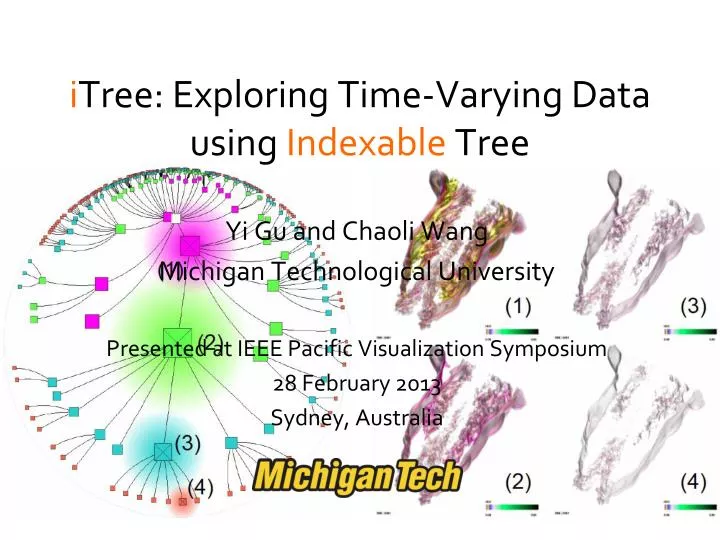
iTree: Exploring Time-Varying Data using Indexable Tree Yi Gu and Chaoli Wang Michigan Technological University Presented at IEEE Pacific Visualization Symposium 28 February 2013 Sydney, Australia
Time-activity curve (TAC) Time-varying medical imaging data [Fang et al. 2007] Importance analysis Multiscale data clustering Temporal sequencing Trend identification What iTree can do for us? Handle ever-growing size and complexity (efficient data compacting) Index and query TACs adaptively (effective data indexing) Interact with space-time data (intuitive visual exploration) TAC-based time-varying data visualization
Keogh’s SIGKDD 2007 tutorial slide c c c b b b a a - - 0 0 40 60 80 100 120 20 Symbolic Aggregate ApproXimation (SAX) C C 0 20 40 60 80 100 120 First convert the time series to piecewise aggregate approximation(PAA) representation, then convert the PAA to symbols It takes linear time [Lin et al. 2003] breakpoints SAX word can be represented by symbols (e.g., a, b, c) or bits (e.g., 00, 01, 10 or 02, 12, 22) baabccbc word length: 8; bit cardinality: 2
Handle time-varying data Use group of voxels over time intervals by going through voxel by voxel for the 1st time step, then the 2nd etc. Modify the original SAX/iSAX algorithms to Better differentiate SAX words (effectiveness) Improve computational performance (efficiency) Make iSAX amenable for visual mapping (visualization) PAA conversion Convert a TAC T of length n to a PAA C of length w SAX for time-varying volume data (1)
Transfer function based breakpoint identification H’: histogram after logarithm and normalization of the original histogram H: new histogram by multiplying H’ by the opacity value SAX for time-varying volume data (2) After Before
SAX word generation Construct an alphabet Φ and transform C into an array of symbol Ĉ to form a SAX word Distance between two symbols Distance between two SAX words Distance between two SAX words is the lower bound of the Euclidean distance defined based on the PAA representation SAX for time-varying volume data (3)
DLB(Q’,S’) D(Q,S) SAX lower bounding Exact (Euclidean) distance D(Q,S) Lower bounding distance DLB(Q,S) Raw data Approx. resp. Q’ Q S’ S DLB(Q’,S’) D(Q,S) Lower bounding means that for all Q and S, we have… DLB(Q’,S’) D(Q,S) Keogh’s SIGKDD 2007 tutorial slide
SAX construction (in sec) Choose 8 to 12 word length and 16 to 32 quantization level are appropriate for quality and speed tradeoff Less than 10 minutes to construct SAX excluding I/O time
iSAX organizes SAX words hierarchically A node represents a set of TACs with the same or similar SAX words Split a node when the number of SAX words exceeds a certain threshold How to split? The original iSAX chooses the symbol with the left-most smallest bit cardinality to split We choose a symbol covering the largest value rangeto split iSAX for time-varying volume data (1) • 22011132 • 22121132 22221132 • 22014332 • 22018432 22019432
Comparison Original breakpoint identification and symbol splitting Our new breakpoint identification and symbol splitting
iSAX construction Voxel IDs for each terminal node are saved into a file Use the SAX word itself as the file name to facilitate search Out-of-core acceleration strategy Partition all voxels or groups into at most 2w buckets and save each non-empty bucket into a file Choose the file with the largest voxel/group count to split if larger than a threshold δn Continue this until no file is larger than δn iSAX for time-varying volume data (2)
Approximate and exact search Both take the PAA representation and a threshold δ as input Approximate search only compares each of the file names with the PAA converted SAX word if the distance is less than δ Exact search needs an additional step: compute PAA-based distance to the input PAA and return those voxels that have a distance less than δ iSAX for time-varying volume data (3)
From iSAX (internal) hierarchy to iTree (external) Number of non-empty children of the root is fairly large Solution: level promoting iSAX has a larger number of hierarchy with small fanout (2) Solution: sibling grouping Sibling nodes are not arranged according to their similarity Solution: sibling reordering Resulting properties The height of the iTree is determined by the maximal bit cardinality for representing any symbol in the SAX words The iTree is balanced: no node has an excessively large fanout Neighboring sibling nodes have a higher degree of similarity in terms of spatial closeness and temporal trend iTree (1)
iTree drawing and focus+context visualization Hyperbolic layout [Laming and Rao 1996] Accommodate a large number of nodes Allow focus+context interaction Add the time ring to indicate the time dimension Query in multiple coordinated views (volume view, iTree view and SAX view) iTree (2)
iSAX/iTree construction (in sec) Reduce the number of nodes an order of magnitude smaller from iSAX to iTree
Brute-force/approx./exact search (in sec) Brute-force search does not use any indexing scheme but simply goes over the PAA representation of data for identifying similar voxels The time cost for approx. search does not increase much from current interval to all time steps (only involving using the names of index files for distance computation)
iTree Data organization, visual representation and user interaction framework for time-varying data analysis and visualization Applicable for tackling big time-varying data sets Limitations Breakpoint identification depends on input transfer function Blockwise TACs lead to block discontinuity in data classification Future work Motif finding (locate previously unknown, frequently occurring patterns) Time-varying multivariate data Acknowledgements U.S. National Science Foundation Summary