Download
1 / 14
140 likes | 151 Vues
Characterizing Megacity Pollution and Its Regional Impact with TES Measurements Changsub Shim, Qinbin Li, Ming Luo, Susan Kulawik, and Helen Worden. The Jet Propulsion Laboratory California Institute of Technology Pasadena, California. 3 rd GEOS-Chem User’s Meeting.

E N D
Characterizing Megacity Pollution and Its Regional Impact with TES Measurements Changsub Shim, Qinbin Li, Ming Luo, Susan Kulawik, and Helen Worden The Jet Propulsion Laboratory California Institute of Technology Pasadena, California 3rd GEOS-Chem User’s Meeting DC8 photo of Mexico City by Cameron McNaughton, University of Hawaii , Feb 2006
Mapping pollution outflow using O3-CO correlation • The observed O3-CO relationship has been used to characterize continental outflow of pollution [Fisherman and Seiler, 1983; Chameides et al., 1987; Parrish et al., 1993, etc.]. Positive O3-CO correlations and ∆O3/∆CO indicate photochemical O3 productions in pollution outflow. • Tropospheric Emission Spectrometer (TES) aboard the Aura satellite provides concurrent retrievals of vertical profiles of O3 and CO. TES O3-CO correlation (at 618 hPa) has been used to map global continental pollution outflow [Zhang et al., 2006].
Objectives • Can we characterize megacity pollution and its regional impactwith TES tropospehric ozone and CO retrievals? • We analyzed TES O3 and CO data over the Mexico City Metropolitan Area (MCMA) and Southern U.S. (15-30°N and 90 - 105°W) during the MILAGRO/INTEX-B campaign (March 2006). • We first compared TES O3 and CO retrievals with those from airborne measurements (DC8 & C130 flights) during this campaign. • The comparisons of O3-CO correlation between airborne measurements, TES retrievals, and GEOS-Chem model were then used to evaluate the TES capability to diagnose urban outflow on a regional scale.
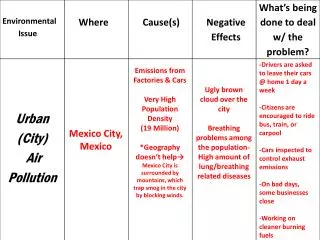
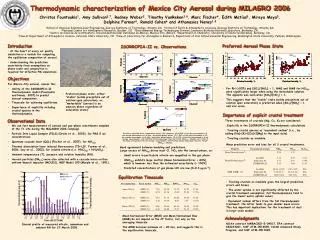
MCMA (19°N, 99°W) • 2nd largest metropolitan area in the world (~20 million inhabitants) within area of ~1,500 km2. • MCMA is surrounded by mountains and thermal inversions often trap pollution within the basin. • The elevation (~750 hPa) is about 2.2 km above mean sea level Lower pO2 makes combustion ineffective, which enhances emissions of CO, VOCs, and O3. • Motor vehicular exhaustion is a very important source of air pollution (3 million aged vehicles).
In-situ measurements during MILAGRO/INTEXB (DC8 and C130) • NSF C-130 for MILAGRO covers (16 – 25°N and 93 – 101°W) in Mar 2006 (red). • NASA DC-8 for INTEX-B covers (15 – 35°N and 90 - 103°W) (blue). • ~6,000 coincident measurements of O3 and CO from the two aircrafts (5-min merge).
TES retrievals • On-board the Aura satellite launched in July 2004 to provide simutaneous 3-D mapping of tropospheric O3, CO, HDO and CH4, amongother species globally. • Use FTIR technique with relatively high spectral resolution (0.1cm-1) and wide spectral range (650 – 3050 cm-1). • The Aura satellite moves in polar sun-synchronous orbit at 705 km height in the ascending node passing equator at 0145 and 1345 LT (16 days for global coverage). • TES has a spatial resolution of 5 x 8 km in nadir-viewing mode. • TES has the standard observations (“global surveys”: 108 km apart along the track) and the special observations (“step and stares”) with denser nadir coverage (45 km apart). • 13 step and stares and 5 global surveys were used in this study for the MILAGRO/INTEX-B periods. • Version 2 data (V002, F03_03) with better quality flags.
TES orbital tracks over MCMA during MILAGRO/INTEX-B Typical TES O3 and CO Averaging Kernel Step and stare Mar 12th , 2006
GEOS-Chem simulations • GEOS-4 met fields (2x2.5 with 30 layers) from NASA GMAO. • Standard full chemistry simulations (O3-NOx-VOC) [version 7- 04 -10]. • Monthly biomass burning emission inventory [Duncan et al., 2003]. • Fossil fuel emission inventory: EDGAR inventory scaled for time and the model grid [Benkovitz et al., 1996; Bey et al., 2001]. EPA/NEI 99 and BRAVO inventories [U.S. EPA, 2004; Kuhns et al., 2005] are used for U.S. and Mexican fossil fuel emissions respectively. • Lightning NOx emissions using parameterization based upon cloud top height and scaled regionally to OTD/LIS observations. • Biogenic emissions: MEGAN inventory [Guenther et al., 2006]. • Spun up for one year and 3-hour O3 and CO results were sampled along the TES orbits. • For comparison with TES retrievals, the TES averaging kernels and a priori profiles were applied to GEOS-Chem vertical profiles.
Observed vertical distributions of O3, CO, and NOx (Mar. 2006) O3 CO NOx Altitude of MCMA ! • MCMA pollution outflow concentrated at 600-800 hPa. • TES has significant sensitivity to 600 – 800 hPa pressure levels. • TES data are good for characterizing the MCMA outflows!
Tropospheric O3 over the MCMA (Mar. 2006) c130 + dc8 (1x1°) TES (4x5°) GEOS-Chem w/AK There is considerable O3 enhancement in the in situ data at 600 – 800 hPa over MCMA. The enhancement is not apparent in TES data nor GEOS-Chem results.
Tropospheric CO over the MCMA (Mar. 2006) c130 + dc8 (1x1°) TES (4x5°) GEOS-Chem w/AK The CO enhancement over MCMA is not apparent in TES data nor GEOS-Chem results.
C130+DC8 GC raw TES (co-located) TES (all) Time series (daily average) comparisons over the MCMA (the regions covered by c130 & dc8 flight tracks gridded @ 2 x 2.5°) between 600 – 800 hPa • TES did not pass over the MCMA for the days of three pollution events (Mar. 9th, 22th, and 29th.). • But the TES data show good agreements with aircraft measurements. • The GEOS-Chem model underestimates both O3 and CO.
O3-CO correlations and ∆O3/∆CO between Aircraft, TES, and GEOS-Chem results. • All results are gridded in 2 x 2.5° and sampled along with aircraft measurements. • The O3-CO correlation derived from TES data is in good agreement with those from in situ and GEOS-Chem/AK resuts, reflecting significant O3 production and transport over the MCMA and surrounding regions.
Conclusions • The pollution outflow from the MCMA and the surrounding regions during MILAGRO/INTEX-B were characterized with aircraft observations, TES tropospheric O3 and CO retrievals, and GEOS-Chem results. • The aircraft observations show significant enhancement of O3, CO, and other chemical species at 600 – 800 hPa, reflecting pollution outflow from the MCMA. These observed vertical distributions are not apparent in TES O3 and CO retrievals due in part to the limited coverage to capture the high pollution events. • The O3-CO correlations derived from TES data are in good agreement with those derived from aircraft observations and GEOS-Chem results (r: 0.47 – 0.91; ∆O3/∆CO: 0.28 – 0.52), reflecting significant O3 production and transport over the MCMA and surrounding regions.