Download
1 / 5
50 likes | 173 Vues
GDP STRUCTURES AND MEASUREMENT. ERAZMUS 2013-2014. METHODS FOR CALCULATING GDP. Σ( R i -MS i ) = Σ ( W j + P j + R j ) = C + I + G + (E- IM ) value added = incomes = final demand with : R i , Ms i – sales and material costs of productive unit i,

E N D
GDP STRUCTURES AND MEASUREMENT ERAZMUS 2013-2014
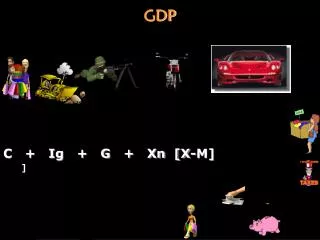
METHODS FOR CALCULATING GDP Σ(Ri-MSi)=Σ(Wj + Pj + Rj)=C + I + G + (E- IM) valueadded=incomes =finaldemand with: Ri, Msi – salesand materialcostsofproductiveunit i, Wj, Pj,Rj – salaries, profitsandrentsofpeopleengaged in production, C – personalconsumption, I - investments, G – governmentconsumption, E – exportsand IM - imports
GDP STRUCTURES PRODUCTION INCOMES FINAL DEMAND ValueaddedSalariesPrivateConsumption IndustrialSectorsDividends Gross Investments (A-F) RetainedProfits Governmentcons. ServicesDepreciationExports (G-O) - Imports GDP,factorprices GDP,factorprices + indirecttaxes+ indirecttaxes - subsidies- subsidies GDP,market pricesGDP,market prices GDP,market prices - incomesincomes GNP,market pricesGNP market, prices - capitaldepletion NNP,market prices
THE GDP STRUCTURES IN 2009 EMU EU27 Slovenia SEEcountries GDP (bill. €) 8963 11790 35.1 109.1 VALUE ADDED (% of GDP) Agriculture 1.6 1.7 2.1 10.72008 Industry 20.7 20.6 22.4 26.2 Services 77.7 77.4 75.5 62.1 INCOMES (% of GDP) Wages 49.4 50.0 53.1 Gross profits 39.3 38.6 35.0 Indirecttaxes 11.2 11.4 12.0 FINAL DEMAND (% of GDP) Privateconsumption 57.7 58.4 55.4 85.22008 Governmentconsumption 22.1 22.4 20.3 18.8 Investments 18.9 18.2 23.0 29.1 Exports 36.3 36.5 58.1 23.1 Imports -35.0 -35.6 -56.8 -57.1
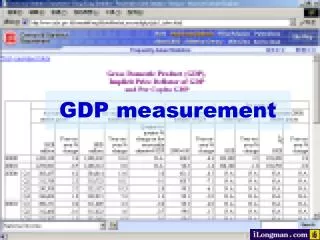
GDP MEASUREMENT PROBLEMSSlovenia 1987-1993 1987198819891990199119921993 GDP billions Din, Sit0.9052.70934.94196.1349.6995.11310 Retailsaleprices 2.4 7.1 100 649 1412 4351 5777 Producersprices2.46.6100490109935444328 GDP in 1989prices37.7 38.1 34.9 30.1 24.7 22.8 22.9 41.1 41.0 34.9 40.0 31.8 28.1 30.9 US$/DinSIT0.0740.2522.8911.3227.5781.30115. GDP v mil. US$122801073912112173261267812240 11141 population 0001989200019991998200119961994 GDP/ cap. US$6172536960688671633461335722