Download
1 / 12
140 likes | 263 Vues
Mapping PM 2.5 Air Pollution in Texas. Zhipeng Xing GIS 2013 Fall Environmental and Water Resources Engineering. PM 2.5. Particulate Matter 2.5 um ~ 10 um Reach into lungs Irritation Coughing/sneezing Asthma/heart disease Reduced visibility Sources Automobile exhausts

E N D
Mapping PM 2.5 Air Pollution in Texas Zhipeng Xing GIS 2013 Fall Environmental and Water Resources Engineering
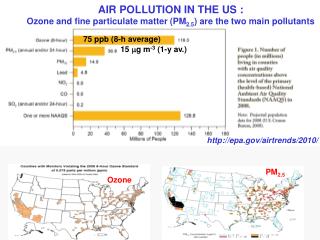
PM 2.5 • Particulate Matter 2.5 um ~ 10 um • Reach into lungs • Irritation • Coughing/sneezing • Asthma/heart disease • Reduced visibility • Sources • Automobile exhausts • Gas/droplets reaction • Cooking/smoking • EPA limit: annual mean 12 μg/m3
Data Source • TCEQ
Conclusion Future Work • High concentration at high population/traffic • Temperature & Precipitation • GOOD NEWS! - No serious PM 2.5 pollution in Texas • Same analysis for the other site • FINISH THE REPORT!!!
Acknowledgement • Dr. Maidment