Download
1 / 24
240 likes | 365 Vues
Distribution of World Population Growth Increases and Decreases . Natural Increase Fertility Mortality. Natural Increase Rates.

E N D
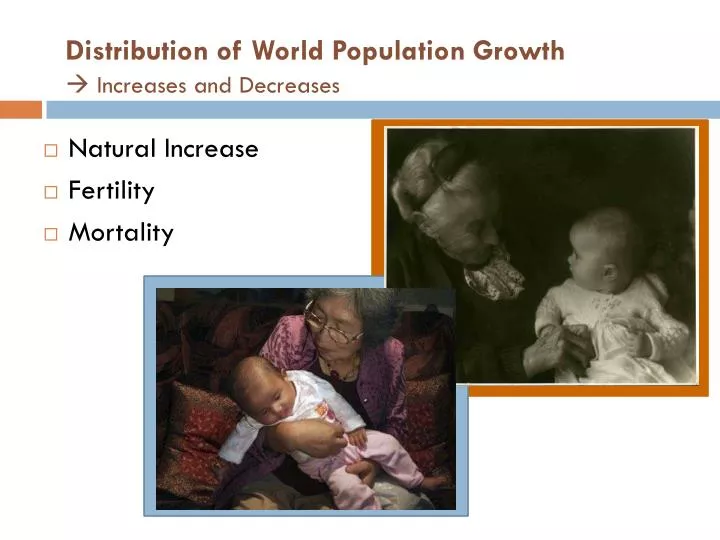
Distribution of World Population Growth Increases and Decreases • Natural Increase • Fertility • Mortality
Natural Increase Rates Fig. 2-7:The natural increase rate (NIR) is the percentage growth or decline in the population of a country per year (not including net migration). Countries in Africa and Southwest Asia have the highest current rates, while Russia and some European countries have negative rates.
Crude Birth Rates Fig. 2-8: The crude birth rate (CBR) is the total number of births in a country per 1000 population per year. The lowest rates are in Europe, and the highest rates are in Africa and several Asian countries.
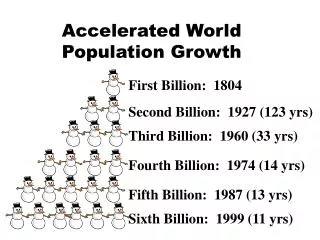
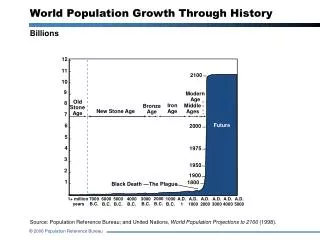
World Population Growth1950 - 2005 Fig. 2-6: Total world population increased from 2.5 to over 6 billion in slightly over 50 years. The natural increase rate peaked in the early 1960s and has declined since, but the number of people added each year did not peak until 1990.
Rates of Natural Increase • Crude Birth Rate (CBR)- Total # of live births per year for every 1,000 people alive • CBR of 20 means that for every 1,000 people, 20 are born over a one year period • Crude Death Rate (CDR)- Total # of deaths a year for every 1,000 people alive • Natural Increase Rate (NIR) is the % by which a population grows in a year • Subtract CDR% from CBR% • Population may still be increasing despite a decreasing NIR • Does not take into account migration into a country/region
Practice: Country A CBR of 45/1,000 CDR of 21/1,000 %NIR? Country B CBR of 13/1,000 CDR of 23/1,000 %NIR? 4.5% 1.3% 2.1% 2.3% 2.4% -1%
Natural Increase Rates • Impact of Small changes on the NIR - even a 1% change is huge considering the base population (the difference between 1 and 2% could be the difference between adding 66 million or 132 million a year! • Doubling Time- how long it takes for the population to double • If we had continued at 2.2% world pop in 2100 would be 15 billion Fig. 2-7:The natural increase rate (NIR) is the percentage growth or decline in the population of a country per year (not including net migration). Countries in Africa and Southwest Asia have the highest current rates, while Russia and some European countries have negative rates.
World Population Growth, 1950–2050 Source: United Nations Population Division, World Population Prospects, The 2008 Revision.
Crude Birth Rates and Total Fertility Rates (TFR) Total fertility rate (TFR) refers to the average number of children a woman will have throughout her child bearing years (15-49) Fig. 2-8: The crude birth rate (CBR) is the total number of births in a country per 1000 population per year. The lowest rates are in Europe, and the highest rates are in Africa and several Asian countries.
Infant Mortality Rates Fig. 2-10: The infant mortality rate is the number of infant deaths per 1000 live births per year. The highest infant mortality rates are found in some of the poorest countries of Africa and Asia. Infant mortality rate (IMR) is the annual number of deaths of infants under 1 year of age per 1,000 live births
Life Expectancy at birth Life Expectancy at birth measures the average number of years a newborn infant can expect to live at current mortality levels Fig. 2-11: Life expectancy at birth is the average number of years a newborn infant can expect to live. The highest life expectancies are generally in the wealthiest countries, and the lowest in the poorest countries. World Life Expectancies
Crude Death Rates Fig. 2-12: The crude death rate (CDR) is the total number of deaths in a country per 1000 population per year. Because wealthy countries are in a late stage of the Demographic Transition, they often have a higher CDR than poorer countries.