Download
1 / 15
150 likes | 233 Vues
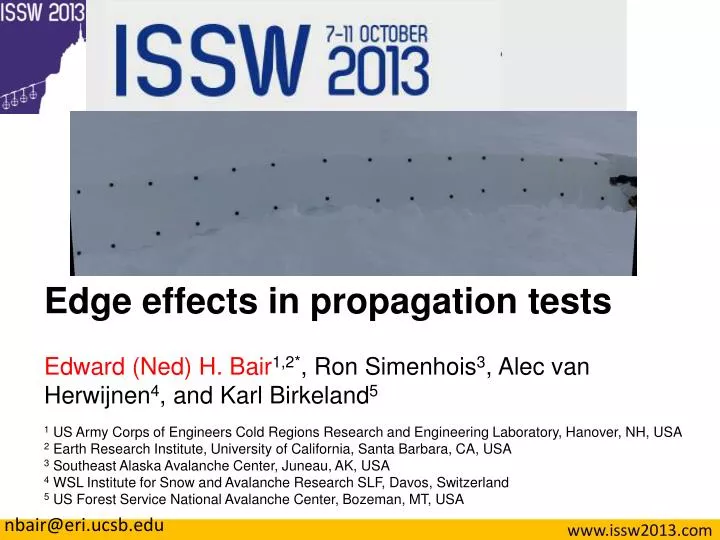
Edge effects in propagation tests Edward (Ned) H. Bair 1,2* , Ron Simenhois 3 , Alec van Herwijnen 4 , and Karl Birkeland 5 1 US Army Corps of Engineers Cold Regions Research and Engineering Laboratory, Hanover, NH, USA

E N D
Edge effects in propagation tests Edward (Ned) H. Bair1,2*, Ron Simenhois3, Alec van Herwijnen4, and Karl Birkeland5 1 US Army Corps of Engineers Cold Regions Research and Engineering Laboratory, Hanover, NH, USA 2 Earth Research Institute, University of California, Santa Barbara, CA, USA 3 Southeast Alaska Avalanche Center, Juneau, AK, USA 4 WSL Institute for Snow and Avalanche Research SLF, Davos, Switzerland 5 US Forest Service National Avalanche Center, Bozeman, MT, USA nbair@eri.ucsb.edu
Introduction, propagation test length guidelines Extended Column Test (ECT), l = 90 cm Propagation Saw Test (PST), l = 100 cm or slab depth; whichever is greater Greene, E., et al., 2010: Snow, Weather, and Avalanches: Observational Guidelines for Avalanche Programs in the United States, 136.
G and G∞ • G – energy release rate of the slab • G∞ – asymptotic energy release rate (no far edge effect) • F(r/l) – correction factor • r is crack length • l is test length
Overview • 163 PSTs and ECTs on beams with l = 1-10 m, including some centered ECTs and PSTs • Particle tracking on markers inserted into beams • Finite element modeling for 3 profiles from pits done at tests
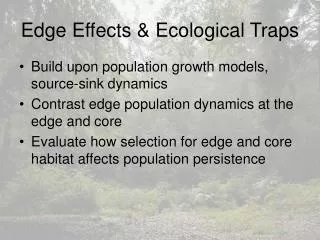
Major findings for ECTs and PSTs • Full crack propagation decreased with test length • Greater collapse occurred at the trigger and far end of the beam than in the center • Wavelengths were ~ 3 m, 2x what is predicted by the anticrack model • The far edge effect is significant for tests up to ~ 2 m
Particle tracking, collapse amplitude • Relative to the middle of the beam, the trigger edge collapsed 160% and the far edge collapsed 128%.
Finite element (FE) results • 3 profiles (a,b,c) • fixed crack length (critical length) for each profile
Centered tests • We experimented with centered PSTs (CPSTs) and found that the critical length doubled. • CPSTs require 2x as much digging for the same crack propagation length as a standard PST, so we find them less practical.
Cool aside • We were able to track the collapse amplitude over time for some of the tests that failed on the same layer. • The average decrease was 0.65 mm/day.
Implications • PST and ECT results are sensitive to test length • Longer tests could decrease false unstable results, *BUT* we need to test this hypothesis. • To test our hypothesis, we will examine the accuracy of 2 m tests vs. standard 1 m tests on slope stability.