Download
1 / 56
560 likes | 673 Vues
My Top Ten Technology Teachable Moments Dan Kennedy Baylor School Chattanooga, TN. T^3 International Conference Chicago, IL March 10, 2007. Moment #1: The Magic Numbers for Retail Wine Pricing. Take the wholesale cost of a case of wine. Add the excise tax ($1.21/gallon today).

E N D
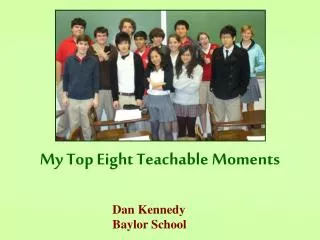
My Top Ten Technology Teachable Moments Dan Kennedy Baylor School Chattanooga, TN T^3 International Conference Chicago, IL March 10, 2007
Moment #1: The Magic Numbers for Retail Wine Pricing
Take the wholesale cost of a case of wine. Add the excise tax ($1.21/gallon today). Divide by 12 to get the bottle cost. Add 30% retail markup. Discount the price 10% (a store policy). Oh, what he would only give for the ability to accomplish all this bothersome math in a single step!
Praying I would not make this look too simple, I did a little Algebra I with the help of my calculator… (x + 1.21 *2.37755) ÷ 12 * (1 + .30) * (1 - .10) = 0.0975 x + 0.28049 So, I told him sagely, all you need to do is multiply your wholesale case cost by 0.0975 and add 0.28049. I thought the man was going to cry.
Moment #2: The Polar Graph of Sin 666θ
1994. My student had just unwrapped his new TI-82 graphing calculator and wanted to graph “something cool.” I told him to put it in POLAR mode and graph r = sin 6 θ.
Then, of course, he decided to graph r = sin 666 θ. The graph was the same as the graph of r = sin 6 θ ! What was going on?
The explanation is not so simple. It starts with the default θ-step in the POLAR window, which is π/24. This would explain why the graph of r = sin 6 θ would be the same as (for example) r = sin 486 θ, since sin 486 θ = sin (6 θ + 480 θ).
But 666 – 6 = 660, which is not an even multiple of 24. In fact, the calculator does not produce the same values for sin 666 θ as it does for sin 6 θ. It actually produces the opposite values, which give the same graph in the end. But why it produces the opposite values is still far from obvious!
Moment #3: Charles Mayfield’s Trig Quiz
1992. My students and I are still adapting to graphing calculators, but my inclination is to let them use them all the time. As a final review of trig identities, I give them my annual “matching quiz from Hell.” Here it is…
We graded it in class, and the grades were abysmal. One student, Charles Mayfield, had a perfect 10. When the other students looked at him in skeptical amazement, he simply grinned and held up his TI-81. Charles had graphed every expression. The class gave him a round of applause.
Now older and wiser, I have learned to put the following logo on some of my quizzes: Sometimes, though, I deliberately leave the calculator back door open, just to reward the Charles Mayfields in my classes. His classmates never doubted that he deserved his 10, and neither did I.
Moment #4: Baylor School’s Graduated GPA
The Challenge: Design a sliding scale that our school could use to convert our numerical (percentage) grades to grade-point averages on a 4-point scale.
The assumptions I made: • Our lowest D (65) should get 1.0. • An average A (95) should get 4.0. • The GPA curve should be steeper at the low end than at the high end I decided to use a power function of the form
I gave the faculty a choice of curves for various p-values, and the runaway winner was p = 1.7.
Baylor continues to use this sliding conversion today, nearly 25 years later. It continues to provide teachable moments for educating students, faculty, administrators, and, of course, parents!
Moment #5: “Magic” Math E-mails from the Clueless
How many of us have received this e-mail from friends wondering what sorcery is behind this trick?
Moment #6: The sine of π/6 degrees
I was showing my Precalculus students how they could leave the calculator in radian mode and use the degree symbol in the ANGLE menu if they needed a temporary mode switch:
Then a student decided to compute the sine of π/6 degrees: “Hey, look,” he cried, “the sine of π/6 degrees is the same as the sine of 30 radians. Isn’t that neat?”
Declaring the calculator to be mistaken is insufficient at a time like this. To do so is to waste a Teachable Moment. Eventually, we figured it out!
Moment #7: Multiple-Choice #36 from the 1988 BC Exam
I gave my Calculus class a quiz that included Multiple-Choice item #36 from the 1988 BC Calculus examination.
So, the correct response is E. In 1988, this was the distribution of responses: A 6% B 1% C 18% D 21% E 48% 0 6%
The difference from the 1988 scenario was that my students had calculators. One girl, who had incorrectly chosen D, computed her integral and compared it to the value of the correct integral in E. She pointed out that they were the same!
This was not even difficult to explain! Consider the graphs of the two integrands on the interval [0, π/2]: Needless to say, I gave the girl credit for D. My friends at ETS were totally unaware that there had been a double key, so the 21% who chose D in 1988 were apparently not so lucky.
Moment #8: Numerical Integration on the TI Calculators
One of the hardest calculus topics to teach in the old days was Riemann sums. They were hard to draw, hard to compute, and (many felt) totally unnecessary.
That was why most of us quickly moved on to antiderivatives, which is how we wanted students to do integrals. Needless to say, when we came to the Fundamental Theorem, students found it to be the greatest anticlimax in the course. Integration and differentiation are reverse operations? Well, duh.
Then along came the TI graphing calculators. Using the integral utility in the CALC menu, students could actually see an integral accumulating value from left to right along the x-axis, just as a limit of Riemann sums would do:
Moment #9: Seeing Power Series Converge
One of the most powerful visualizations in mathematics is the spectacle of the convergence of Taylor series. Here are the Taylor polynomials for sin x about x = 0:
Here are their graphs, superimposed on the graph of y = sin x:
Moment #10: We All Use Math Every Day
NUMB3RS Activity: A Party of Six Episode: “Protest” Topic:Graph Theory and Ramsey Numbers Grade Level:8 - 12 Objective:To see how a complete graph with edges of two colors can be used to model acquaintances and non-acquaintances at a party. Time:About 30 minutes Materials:Red and blue pencils or markers, paper
If two people (A and B) are at a party, there are only two possibilities: either A and B know each other, or A and B do not know each other. Draw the two possible graphs below. • A • A • B • B
Draw all of the possible 3-person party graphs for A, B, and C below.
There are 64 possible 4-person party graphs for guests A, B, C, and D (Why?), but you will not be asked to draw them all. Instead, draw the 8 possible 4-person party graphs in which A, B, and C all know each other. We say A, B, and C aremutual acquaintances.
It is actually possible to color the edges of a 5-person party graph in such a way that there are neither three people that are mutual acquaintances nor three people that are mutual non-acquaintances. Can you do it?