Download

1 / 55
550 likes | 701 Vues
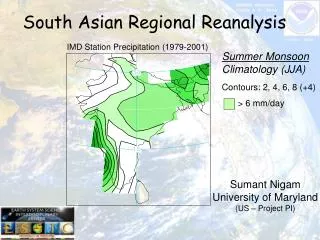
UM 4D-Var Regional Reanalysis Progress. Richard Renshaw, Stephen Oxley, Adam Maycock, Peter Jermey, Dale Barker, Tom Green, DingMin Li. Contents. Technical highlights First full reanalysis 2008/9 Validation Developments for 2013/14.

E N D
UM 4D-Var Regional Reanalysis Progress Richard Renshaw, Stephen Oxley, Adam Maycock, Peter Jermey, Dale Barker, Tom Green, DingMin Li
Contents Technical highlights First full reanalysis 2008/9 Validation Developments for 2013/14
WP2.1 Building capacity for advanced regional data assimilation orography 12km grid 480 x 384 reanalysis period 2008/2009
Technical Highlights Capability to generate ODBs
ODB – obs monitoring database ODB stores observations + qc + O-B + O-A + ... Established ECMWF database + utilities Array of tools available “for free” Metview macros (quick look) Obstat (detailed stats / graphics)
Technical Highlights Capability to generate ODBs Able to archive reanalysis fields in ECMWF mars
4 Parallel Streams 2009 2008 A B C D with 1 month overlap for spin-up
How long to spin up ? rms screen temperature
How long to spin up ? rms surface pressure
Var Resolution UM 12km Var 24km
Var Resolution 4DVar run time: 36km 1 node hour 24km 3 node hours 12km 20 node hours UM T+24 1.5 node hours
Observations Surface (SYNOP, buoy, etc) incl visibility Upper air (sonde, pilot, wind profiler) Aircraft AMV (‘satwinds’) GPS-RO Scatterometer winds ATOVS AIRS IASI GPSRO MSG clear sky radiances
Bias correction ofsatellite radiances Initial reanalysis: Radiances processed, not assimilated monthly bias statistics Final reanalysis: Radiances assimilated
Verification - Results • Verifying at T+6 – a good analysis should produce a good short range forecast Jul/Aug 08 Jan 08 +6.6 wtd skill diff +2.7 wtd skill diff Sept/Oct 09 +3.2 wtd skill diff
Statistics and EXTREME Statistics!
Statistics Extreme Statistics are defined as ‘core indices’ of climate change by The joint CCI/CLIVAR/JCOMM Expert Team on Climate Change Detection and Indices. Standard Statistics Extreme Statistics • We calculate these statistics for ERA and EURO4M and compare with observations statistics from European Climate Assessment & Dataset ECA&D http://eca.knmi.nl • Mean • Max of Daily Max • Std Dev • Max of Daily Min • Range • Min of Daily Max • Min of Daily Min Summer Days Count of days for which daily max T>25 degrees • Icing days, Frost days, Summer days, Tropical Nights Wet Days A day on which precip is greater than 1mm • Maximum count of consecutive dry/wet days Percentiles For base period (ERA) 1961-1990 • Count of wetdays, count of days with precip above 10mm, 20mm. • Average precip on wetdays, max precip on 5 consecutive days, maximum precip on a single day, total precip, precip above 95th and 99th percentiles. • Percentage of days where max temp > 90th percentile etc…
July 2008 Floods Max of 5 Daily Precip/mm RMS Mean -37 73 ERA ERA 69 -36 EURO4M • EURO4M more detail • EURO4M closer to Obs • Both models not as wet as Obs EURO4M mm
Cloud assimilation NAE assimilates 3D cloud fields from nowcasting system (combines satellite imagery + surface reports) EURO4M will have to rely on using surface reports directly
Cloud from SYNOP reportsPeter Francis Wattisham, 00Z 2012/03/13AAXX 13004 03590 11238 83504 10064 20060 30240 40352 53002 60001 71022 886// 92350 333 55/// 20411 84703 86706 88708
Cloud from SYNOP report Wattisham, 00Z 2012/03/13AAXX 13004 03590 11238 83504 10064 20060 30240 40352 53002 60001 71022 886// 92350 333 55/// 20411 84703 86706 88708 84703 4 oktas Stratus, height 90m
Cloud from SYNOP report Wattisham, 00Z 2012/03/13AAXX 13004 03590 11238 83504 10064 20060 30240 40352 53002 60001 71022 886// 92350 333 55/// 20411 84703 86706 88708 84703 4 oktas Stratus, height 90m 86706 6 oktas Stratus, height 180m 88708 8 oktas Stratus, height 240m
Precipitation assimilation • Operational UK models assimilate radar rainrate (latent heat nudging) • For EURO4M, aim to assimilate raingauge accumulations
Precipitation assimilation Plan Use E-Obs gridded daily precipitations Keith Ngan, Andrew Lorenc, Richard
Precipitation assimilation Plan Use E-Obs gridded daily precipitations System to disaggregate 24hr accumulations to 6hrs Var outer loop with spin-up problems minimised (analysis increments trigger rain in model). Keith Ngan, Andrew Lorenc, Richard
Variational Bias Correction Airmass-dependent bias correction of satellite radiances (based on Harris and Kelly, 2001) Currently coeffs c are calculated off-line monthly VarBC will give smooth and automatic updating Code is in place – hope to trial in 2013 (DingMin Li, Andrew Lorenc , Dale Barker)
Collaboration – Cross-Validation Compare our reanalysis against: SMHI ERA Obs climatologies Peter
Summary • Initial reanalysis is run (2008-9) • new validation tools • Production reanalysis will be better: • satellite radiances • surface cloud • ODBs and mars archive • A final reanalysis aims to include later developments • precipitation assimilation • variational bias correction
model orography ERA-Interim Model T255 (80km) Var T159 (125km) Met Office Model 12km Var 24km
ERA-Interim vs EURO4M • T255 (80km), 60 levels • T159 (125km) 4D-Var • 12-hour analysis window • assimilate: • conventional obs • satellite radiances • 12km, 70 levels • 24km 4D-Var • 6-hour analysis window • assimilate: • conventional obs incl vis • satellite radiances • GPS (ground & RO) • Cloud • Precipitation • Initial state and boundary conditions from ERA-Interim analyses
Observation processing Corrections to radiosonde temperature, surface pressure, - use same as UKMO Global Rejection lists - use old UKMO Global and NAE lists
Observations from ECMWF Surface (SYNOP, buoy, etc) incl visibility Upper air (sonde, pilot, wind profiler) Aircraft AMV (‘satwinds’) ATOVS AIRS IASI GPSRO MSG clear sky radiances
Observations from MetDB Ground-based GPS Scatterometer winds
(Per(Anal))2 – Fc2 Skill = (Per(Anal))2 Verification • Description of Work: Temperature, Water Vapour, Rel. Hum. Surf. P., Surf. Radiation Budget, Wind, Earth Radiation Budget, Cloud Properties, Tot/Base Snow Cover, SST, Precip, and Visibility. • Skill Scores (as in NWP Index): • ETS as (in UK Index): Total Cloud 3, 5, 7 octs. Cloud Base 100m, 500m, 1500m Precip 0.5mm, 1mm, 4mm Vis (1.5m) 200m, 1000m, 4000m
February 2009 Snow Min of Daily Min Temp/degrees Max of Daily Precip/mm ERA EURO4M
February 2009 Snow Min of Daily Min Temp/degrees RMS Mean 0.3 2.8 ERA ERA 2.3 0.9 EURO4M • EURO4M closer to Obs • EURO4M larger bias EURO4M • EURO4M and ERA warmer than obs
February 2009 Snow Max of Daily Precip/mm RMS Mean -5.6 7.5 ERA ERA 6.2 -0.45 EURO4M • EURO4M closer to Obs • EURO4M smaller bias EURO4M • EURO4M and ERA dryer than obs