Download
1 / 26

E N D
EKG Basics All MIHS hospital nursing staff must complete an EKG test with a score of at least 80% upon hire. All hospital RNs are tested annually. This includes recognizing the rhythms, measuring the intervals, and knowing the appropriate treatment/algorithm according to American Heart Association. This is basic ACLS/PALS information, nothing new. In addition to this study packet, there are multiple websites that can be accessed on the internet from which to study. These can be found with a google search for EKG strips.
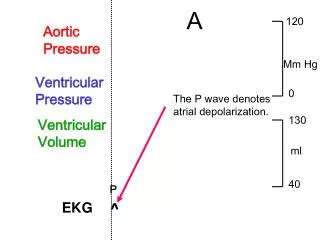
P Wave • First component of a normal ECG • Represents the spread of electrical activity over the atrium, atrial depolarization. The normal depolarization begins at the sinoatrial (SA) node near the top of the atrium. Because of the top-to-bottom, right-to-left path, the P wave is normally largest in Lead II • Impulses either originate in the SA node, the atria, or the atrioventricular (AV) junction • If a P wave precedes each QRS complex, then the impulses are being conducted from the atria to the ventricles • Location: does it precede or follow the QRS complex, is it identifiable • Configuration: usually rounded and upright in all leads except R • Amplitude is usually 2-3 mv in any lead
PR Interval • Measured from the beginning of the P wave (atrial depolarization) to the beginning of the QRS complex (ventricular depolarization) • Represents the time it takes for an impulse to travel from the SA node through the atria and the AV node • Normally between 0.12 to 0.20 seconds in duration • If prolonged, > 0.20 seconds indicates conduction delay through the AV node and is called a 1st degree AV block
QRS Complex • Represents activation of the ventricles, ventricular depolarization • Special conducting bundles spread the wave of depolarization rapidly over the bundles • May have one, two or all three components : Q R S • Q wave is the first negative wave after the P wave and before the R wave. The Q wave represents activation of the ventricular septum • R wave is the first positive wave after the P wave. Most of the ventricle is depolarized during the R wave. • S wave is the negative wave after the R wave. • Normal QRS duration is 0.06 to 0.12 seconds • Lengthening of the QRS indicates some blockage of the electrical conduction system either due to ischemia, necrosis of the conducting tissue, electrolyte imbalance or hypothermia
ST Segment • Represents beginning of ventricular repolarization • Measured immediately after QRS complex to the beginning of the T wave • Normally isoelectric • Prolonged ST may indicate hypocalcemia • Elevated ST may indicate pericarditis, infarction, aneurysms • Depressed ST may indicate ischemia or digitalis toxicity or may be nonspecific • J-point is where the QRS complex and the ST segment meet
Q-T Interval • QT interval represents total ventricular activity. It is the summation of ventricular depolarization to repolarization • Can vary with heart rate • Measured from the beginning of the Q wave to the end of the T wave • Corrected QT interval (QTc) takes heart rate into account and provides various normal values based on the rates • Rule of thumb – QT interval should be less than half the preceeding R-R interval • The U wave represents repolarization of the Purkinje fibers but isn’t always seen on paper. A prominent U wave may be caused by hypercalcemia or hypokalemia
Putting It All Together • Is the lead placement correct? • Is the strip labeled with the correct patient’s name? • NEVER FORGET YOU ARE TREATING A PATIENT, NOT JUST AN EKG RHYTHM ! Right Arm & Left Arm electrodes should be placed just below each clavicle. Right Leg & Left Leg electrodes should be placed on a non-muscular surface on the lower edge of the rib cage. Center electrode should be placed 4th ICS, right of the sternum for MCL1 monitoring
Lead I, Lead II, Lead III Electrode Placement Each lead consists of a positive pole and a negative pole. An EKG lead provides a particular view of the hearts electrical activity between the 2 poles. The direction in which the electric current flows determines how the waveforms appear on the EKG tracing.
Putting it All Together • What is the rate? Regular or Irregular? • P waves • Are P waves present ? • Is there a P wave occurring regularly ? • Are the P waves smooth, rounded and upright in appearance ? Are they inverted ? • Do all the P waves look similar ? • PR interval • Is the PR interval < 0.12 or > 0.20 seconds ? • Is the PR interval constant across the strip ? • QRS Complex • Is the QRS complex > 0.12 seconds ? If so, the complex may be ventricular in origin. • Is the QRS complex < 0.12 seconds ? If so, the complex is most likely supraventricular in origin. • QT interval • Is the QT interval half of the preceding R-R interval ? • ST Segment • Normal, depressed or elevated ? • Is the T wave normal in appearance?
EKG Paper • Horizontal lines measures time • Allows for measurement of waves, complexes, & intervals • Small box = 0.04 seconds • Large box = 0.20 seconds • 5 large boxes = 1 second • Vertical lines measure voltage in millivolts (mv) • Allows for measurement of amplitude of P waves, QRS complexes & T waves • Useful in detection of atrial & ventricular hypertrophy • Small box = 0.1 mv • Large box = 0.5 mv • Rhythm strip is the printed record of the electrical activity of the heart
Premature Atrial Contraction (PAC) • Irregular rhythm • P wave – premature, occurs earlier than the next expected sinus P wave. Beat originates in the atria, not in the sinus node. Usually the premature P wave looks different from the sinus P wave • PR interval – 0.12 to 0.20 seconds. The PAC has a different PR interval than the underlying rhythm • QRS – less than 0.12 seconds unless intraventricular delay exists • The early P wave is conducted and a QRS complex should follow the premature P wave. Usually benign and are very common. Can be caused by emotional stress to caffeine consumption
Premature Ventricular Contractions (PVC’s) • Usually a regular rhythm with premature beat • Rate - dependent on the underlying rhythm • P wave – does not have an associated P wave • Cannot measure PR interval on premature beat • QRS is usually widened and bizarre. Measures > 0.12 seconds. QRS looks different than the patient’s normal QRS • PVC’s may occur in patterns such as bigeminy, trigeminy, or couplets • There are unifocal PVC’s and multifocal PVC’s. Unifocal, or uniform PVC’s, look the same in the same lead. They have originated from the same foci in the ventricle. Multifocal PVC’s appear different from each other in the same lead. • PVC’s can be benign and normal is some individuals. Patient need to be assessed clinically for hemodynamic tolerance of the PVC’s
First Degree Heart Block • Results from excessive conduction delay in AV node • Impulse between atria and bundle of HIS is delayed at level of AV node • PR interval will exceed 0.20 • Not actually dysrhythmia, delay rather than actual block but is referred to as block • May closely resemble NSR at quick glance, use criteria to interpret strips! • Usually benign rhythm but may be seen in patients who are taking calcium channel blockers, beta blockers, digoxin
2nd Degree AV Block, Type I (Wenckebach) • Atrial rhythm is regular, the ventricular rhythm is irregular • P waves are normal in configuration • PR interval – progressively lengthens until a P wave is not followed by a QRS. • QRS complex – there are more P waves than QRS complexes • This occurs when some, but not all, atrial impulses are blocked from reaching the ventricles. This is usually caused by a conduction delay within the AV node and is usually associated with AV nodal ischemia. Most patients tolerate this rhythm. Patients will need to be monitored for hemodynamic compromise
Second Degree: Type I • Note increasing length of PR interval until an atrial impulse is not conducted • Cycle will then repeat • Creates “group beating”
2nd Degree AV Heart Block, Type II • Atrial rhythm regular, ventricular rhythm irregular • Atrial rate is greater than the ventricular rate. Ventricular rate is often slow • P wave – there are P waves not followed by a QRS • PR interval – constant for each conducted QRS • QRS – more P waves than QRS complexes • Usually more ominous than Wenchebach. Can deteriorate to 3rd degree heart block. Patient needs to be monitored clinically for hemodynamic compromise.
Second Degree: Type II • PR interval is constant • More P’s than QRS’s • Ventricular rhythm may be regular or irregular
3rd Degree Heart Block • Also known as complete heart block • Atria and ventricles are contracting independently of each other • Ventricular rate is usually 40-60 beats/min if the escape pacemaker is from the junction; 20-40 beats/min if escape pacemaker is from the ventricles • There is no true PR interval. No atrial impulses pass through the AV node and the ventricles generate their own rhythm • QRS – if block occurs at the AV node or bundle of His, the QRS will appear normal. If the block occurs at the bundle branch level, the QRS will be widened • Causation – can be the result of parasympathetic tone associated with inferior infarction, toxic drug effects, or damage to the AV node
Complete Heart Block • No consistent PR interval • More P’s than QRS’s • P’s will “march” out as well as QRS but not in relation to one another
Myocardial Ischemia • Myocardial ischemia results when the heart’s demand for oxygen exceeds its supply from the coronary circulation. Ischemia can resolve by reducing the oxygen needs of the heart or increasing blood flow by dilating the coronary arteries with medication such as nitroglycerin. • Myocardial ischemia delays repolarization. Characteristic EKG changes involve the ST segment & the T wave. ST segment depression is suggestive of MI & is considered significant when the ST segment is more than 1 mm below the baseline • An inverted T wave will be present in the leads facing the affected area of the ventricle if ischemia is present through the full thickness of the myocardium • The T wave is usually upright if ischemia is present only in the subendocardial layer
Myocardial Injury • Myocardial injured cells do not function normally, affecting both muscle contraction and the conduction of electrical impulses • EKG changes include ST elevation, normally the ST segment is isoelectric • Elevation of the ST segment is consistent with injury • ST segment elevation is earliest sign of AMI • Significant if 1mm or greater in two contiguous leads • ST segment will return to baseline over time, conditions where it does not include: pericarditis & ventricular aneurysm