Download
1 / 16
160 likes | 247 Vues
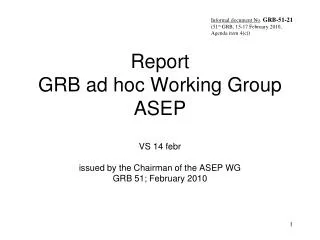
ASEP stringency analysis issued by the Netherlands GRB 51; February 2010. Informal document No . GRB-51-24 (51 st GRB, 15-17 February 2010, Agenda item 4(c)). Where to draw the limit line: that’s the question. 2. ASEP limit depends on X, Y, Z and Bonus. 3.

E N D
ASEP stringency analysisissued by the NetherlandsGRB 51; February 2010 Informal document No. GRB-51-24 (51st GRB, 15-17 February 2010, Agenda item 4(c))
Stringency of ASEP depends on distance from measurements to limit Measurements Stringency result = Max (measurement – limit)
Explanation of results Vehicle data Expert judgement Annex 3 results ASEP results KBA results Every row = 1 vehicle Every column = 1 ASEP variant
Explanation of results ASEP method 1 bonus: yes ASEP method 1 bonus: no ASEP method 2 Uncritical vehicles ASEP: pass High potential to increase ASEP: border case Border case vehicles ASEP: fail Vehicles of concern
Target: colour matching Uncritical vehicles ASEP: pass Border case vehicles ASEP: border case Vehicles of concern ASEP: fail
Explanation of results Statistics of ASEP variants Average % correct
Analysis / conclusions • Method 1: • KBA proposal solves 10 out of 13 vehicles “with high potential to increase” • unsolved vehicles are tested in R51.02 in 2nd and 3rd gear • “bonus=yes” always higher score than “bonus=no”
Analysis / conclusions Proposal 2 is more stringent than proposal 1 • Proposal 2 has more “hits” (VOC = fail): 100% vs 7% • Proposal 2 has more “collateral damage” (uncritical ≠ pass): 12% vs 5%
Analysis / conclusions • Method 2: % collateral damage can be reduced with more lenient variants • Method 1: % hits can be increased with more stringent variants • Soon collateral damage is bigger than in method 2 • Highest score: method 2 (9,3,3) • % correct = 82% • % hits = 100% • % collateral damage = 1%
Follow up • Effect of other Annex 3 limits • Other method 1 variants ? • Compromises as mentioned by chairman
Method 1 investigates relative,not absolute noise emission Vehicle 200-13 Lmax in control range = 95 dB(A) OICA proposal is uncritical D = 3,4 dB(A) Vehicle 1-26 Lmax in control range = 76 dB(A) OICA proposal becomes critical D = 0,4 dB(A) 15
What is 100 dB(A)? 100 dB(A) = 100 * 80 dB(A) 1 supersportcar = 100 heavy trucks Need for Not to exceed level 16