Download

1 / 2
20 likes | 173 Vues
YOUR LOGO/INSTITUTION NAME HERE. Lean Six Sigma Black Belt Blended Learning Program. Course Description. Lean Six Sigma (LSS) is a disciplined process improvement approach focused on reducing waste, increasing

E N D
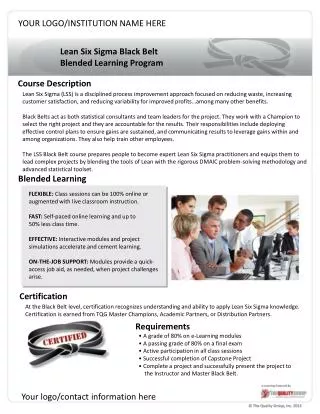
YOUR LOGO/INSTITUTION NAME HERE Lean Six Sigma Black Belt Blended Learning Program Course Description Lean Six Sigma (LSS) is a disciplined process improvement approach focused on reducing waste, increasing customer satisfaction, and reducing variability for improved profits…among many other benefits. Black Belts act as both statistical consultants and team leaders for the project. They work with a Champion to select the right project and they are accountable for the results. Their responsibilities include deploying effective control plans to ensure gains are sustained, and communicating results to leverage gains within and among organizations. They also help train other employees. The LSS Black Belt course prepares people to become expert Lean Six Sigma practitioners and equips them to lead complex projects by blending the tools of Lean with the rigorous DMAIC problem-solving methodology and advanced statistical toolset. Blended Learning FLEXIBLE: Class sessions can be 100% online or augmented with live classroom instruction. FAST: Self-paced online learning and up to 50% less class time. EFFECTIVE: Interactive modules and project simulations accelerate and cement learning. ON-THE-JOB SUPPORT: Modules provide a quick-access job aid, as needed, when project challenges arise. Certification At the Black Belt level, certification recognizes understanding and ability to apply Lean Six Sigma knowledge. Certification is earned from TQG Master Champions, Academic Partners, or Distribution Partners. Requirements • A grade of 80% on e-Learning modules • A passing grade of 80% on a final exam • Active participation in all class sessions • Successful completion of Capstone Project • Complete a project and successfully present the project to the Instructor and Master Black Belt. Your logo/contact information here
YOUR LOGO/INSTITUTION NAME HERE Standard Course Outline (many blends/combinations are possible) Session 6 - Making Inferences e-LEARNING MODULES Probability Distributions: Discrete Random Variables PRE-CLASS Time Class Continuous Probability Distributions: Normal Curve Class Kick-Off ~.5 hrs ~4.8 hrs 2.0 hrs Introduction to Inferential Statistics Session 1 - Introduction Confidence Interval for the Mean Six Sigma Introduction Hypothesis Tests for the Mean Introduction to Lean Principles* ~4 hrs 1.5 hrs Session 7 - Statistical Testing Introduction to Lean Office and Service* Comparing Means Project Management Introduction Inferential Statistics: Self Assessment Session 2 – Defining the Project ~4.5 hrs 2.0 hrs Hypothesis Testing for Nonparametric Data Voice of the Customer ANOVA Managing the Project Organizing and Presenting Data Session 8 - Correlation and Regression Kaizen Event* ~4.3 hrs 1.5 hrs Making Inferences about Proportions SIPOC Making Inferences about Variances Mapping the Process ~3.6 hrs 2.0 hrs Simple Linear Regression Intro. to the Theory of Constraints Multiple Regression Session 3 – Defining the Project Session 9 - Designing Experiments Eight Wastes* Measurement System Analysis Introduction to Design of Experiments Current State Value Stream Mapping* Full Factorial Designs ~2.3 hrs 2.0 hrs Future State Value Stream Mapping* ~4.4 hrs 2.0 hrs Fractional Factorial Designs Process-Based Costs Session 10 - Making Improvements Cause and Effect Diagrams What is Statistics? Total Productive Maintenance Organizing and Presenting Data Workplace Design and Layout* Session 4 – Process Analysis Changeover Reduction Pareto Analysis ~2.6 hrs 1.5 hrs Standard Work* Scatter Diagrams Flow and Pull Systems* Measures of Central Tendency ~4.3 hrs 1.5 hrs Session 11 - Controlling the Process Measures of Dispersion Selecting the Solution Measurement System Analysis Control Charts ~2hrs 5S* 1hr Controlling the Process Session 5 – Baseline and Root Cause Totals: e-Learning = ~40 hrs Class Time = 20 hrs Introduction to Process Capability (*) denotes Healthcare Only version is available Process Capability Assessments Capstone Project 4 days Cause and Effect Diagrams ~3.6 hrs 2.0 hrs Certification Exam 4 hrs Failure Mode and Effects Analysis Visual Management* Optional Error Proofing* Introduction to Probability Black Belt Test Prep: Modules 1-5 Your logo/contact information here