Download
1 / 31
310 likes | 579 Vues
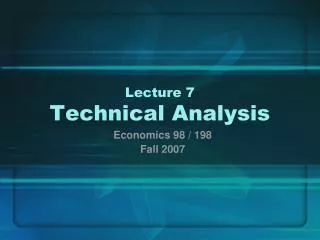
Technical Note 7. Waiting Line Management. OBJECTIVES. Waiting Line Characteristics Suggestions for Managing Queues Examples (Models 1, 2, 3, and 4). Servicing System. Servers. Waiting Line. Customer Arrivals. Exit. Components of the Queuing System. Queue or. Finite. Infinite.

E N D
Technical Note 7 Waiting Line Management
OBJECTIVES • Waiting Line Characteristics • Suggestions for Managing Queues • Examples (Models 1, 2, 3, and 4)
Servicing System Servers Waiting Line Customer Arrivals Exit Components of the Queuing System Queue or
Finite Infinite Customer Service Population Sources Population Source Example: Number of machines needing repair when a company only has three machines. Example: The number of people who could wait in a line for gasoline.
Constant Variable Service Pattern Service Pattern Example: Items coming down an automated assembly line. Example: People spending time shopping.
Length Number of Lines & Line Structures Queue Discipline Service Time Distribution The Queuing System Queuing System
One-person barber shop Car wash Bank tellers’ windows Hospital admissions Examples of Line Structures Single Phase Multiphase Single Channel Multichannel
BALK RENEG Degree of Patience No Way! No Way!
Suggestions for Managing Queues 1. Determine an acceptable waiting time for your customers 2. Try to divert your customer’s attention when waiting 3. Inform your customers of what to expect 4. Keep employees not serving the customers out of sight 5. Segment customers
Suggestions for Managing Queues (Continued) 6. Train your servers to be friendly 7. Encourage customers to come during the slack periods 8. Take a long-term perspective toward getting rid of the queues
Waiting Line Models Source Model Layout Population Service Pattern 1 Single channel Infinite Exponential 2 Single channel Infinite Constant 3 Multichannel Infinite Exponential 4 Single or Multi Finite Exponential These four models share the following characteristics: Single phase · Poisson arrival · FCFS · Unlimited queue length ·
Example: Model 1 Assume a drive-up window at a fast food restaurant. Customers arrive at the rate of 25 per hour. The employee can serve one customer every two minutes. Assume Poisson arrival and exponential service rates. Determine: A) What is the average utilization of the employee? B) What is the average number of customers in line? C) What is the average number of customers in the system? D) What is the average waiting time in line? E) What is the average waiting time in the system? F) What is the probability that exactly two cars will be in the system?
Example: Model 1 A) What is the average utilization of the employee?
Example: Model 1 B) What is the average number of customers in line? C) What is the average number of customers in the system?
Example: Model 1 D) What is the average waiting time in line? E) What is the average waiting time in the system?
Example: Model 1 F) What is the probability that exactly two cars will be in the system (one being served and the other waiting in line)?
Example: Model 2 An automated pizza vending machine heats and dispenses a slice of pizza in 4 minutes. Customers arrive at a rate of one every 6 minutes with the arrival rate exhibiting a Poisson distribution. Determine: A) The average number of customers in line. B) The average total waiting time in the system.
Example: Model 2 A) The average number of customers in line. B) The average total waiting time in the system.
Example: Model 3 Recall the Model 1 example: Drive-up window at a fast food restaurant. Customers arrive at the rate of 25 per hour. The employee can serve one customer every two minutes. Assume Poisson arrival and exponential service rates. If an identical window (and an identically trained server) were added, what would the effects be on the average number of cars in the system and the total time customers wait before being served?
Example: Model 3 Average number of cars in the system Total time customers wait before being served
Example: Model 4 The copy center of an electronics firm has four copy machines that are all serviced by a single technician. Every two hours, on average, the machines require adjustment. The technician spends an average of 10 minutes per machine when adjustment is required. Assuming Poisson arrivals and exponential service, how many machines are “down” (on average)?
Example: Model 4 N, the number of machines in the population = 4 M, the number of repair people = 1 T, the time required to service a machine = 10 minutes U, the average time between service = 2 hours From Table TN7.11, F = .980 (Interpolation) L, the number of machines waiting to be serviced = N(1-F) = 4(1-.980) = .08 machines H, the number of machines being serviced = FNX = .980(4)(.077) = .302 machines Number of machines down = L + H = .382 machines
Queuing Approximation • This approximation is quick way to analyze a queuing situation. Now, both interarrival time and service time distributions are allowed to be general. • In general, average performance measures (waiting time in queue, number in queue, etc) can be very well approximated by mean and variance of the distribution (distribution shape not very important). • This is very good news for managers: all you need is mean and standard deviation, to compute average waiting time
Queue Approximation Inputs: S, , , (Alternatively: S, , , variances of interarrival and service time distributions)
Approximation Example • Consider a manufacturing process (for example making plastic parts) consisting of a single stage with five machines. Processing times have a mean of 5.4 days and standard deviation of 4 days. The firm operates make-to-order. Management has collected date on customer orders, and verified that the time between orders has a mean of 1.2 days and variance of 0.72 days. What is the average time that an order waits before being worked on? Using our “Waiting Line Approximation” spreadsheet we get: Lq = 3.154 Expected number of orders waiting to be completed. Wq = 3.78 Expected number of days order waits. Ρ= 0.9 Expected machine utilization.