Download
1 / 10
100 likes | 268 Vues
Dashboards. Slide by ana’s presentation. Tired of these challenges?. 1. No centralized view of executive information from multiple functional areas and systems; no drill-down options. Lack of transparency, leading to loss of productivity.

E N D
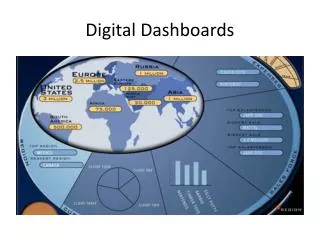
Dashboards • Slide by ana’s presentation
Tired of these challenges? 1 No centralized view of executive information from multiple functional areas and systems; no drill-down options. Lack of transparency, leading to loss of productivity. Incorrect decisions based on inadequate data Not sufficient knowledge about summary of the issue and what are its KPIs? Do your execs have no understanding of how is data connected? Lack of idea about overview of the issue. 2 3 4 5 6
Solution is here! Dashboards • Everyday tons of transaction data gets posted into the system, still the middle and top management struggle to get information to initiate right actions to achieve. But wait no more…. • Give your decision makers an easier way to explore insights and test out future business scenarios. Dashboard software offers users personalized, drag-and-drop functionality and interactive gauges, charts, and widgets – for instant access to clear, understandable metrics.
Key Features Company performance status in on glance. Interactive visual models – present complex business data clearly and dynamically for faster decision making power with detailed and "what if" analysis. Comprehensive models with aggregated data and summarized data presentation. Superior flexibility for IT and business users with direct connectivity to live data sources. Secure data access – Maintain control in every dashboard. Easy publishing and deployment with intuitive visualizations and templates.
Solution Overview Company Performance Status in a glance Consistent and Dynamic data access Fast and accurate access to company KPIs Controlled data sharing with enablement for precise and measured data access
Solution Overview Standard and easy UI for formatting, editing and exporting dashboards Interactive visual models with aggregate data representation Excel and live office connectivity serving as a data model, a calculation engine and an eventing model Flexible, real-time analysis of large sets of pre-aggregated data Component Management - Dashboard offers Easy Component selection and modification and hiding and locking of components and groups Smart Interactive features- selectors, sliders for interactive if-else analysis, alerts and drill-down features for detailed analysis
Solution Overview Direct connectivity to live data sources • A single model can contain an unlimited number of Service Connections, because these connections are independent from consumers and providers. • However, a model can contain one Provider Data Connection, one Consumer Data Connection, or neither. • SAP BusinessObjects Dashboards enables use of data from managed SAP BusinessObjects Enterprise databases via a Live Office connections • SAP BusinessObjects Dashboards allows dashboard model to connect to external SAP data sources
Solution Overview Secure and Easy Publishing and Deployment • Your dashboards can be published in a variety of formats including - Macromedia Flash (SWF) Adobe AIR Adobe Acrobat 6 (PDF) Adobe Acrobat 9 (PDF) HTML Microsoft PowerPoint Microsoft Outlook Microsoft Word BusinessObjects Enterprise • For all formats, the model is saved as a Flash SWF file and then inserted into the selected program. • As a SWF file, the model does not require Dashboards to be on the local drive to run.
In a Nutshell • Dashboard enables executives to monitor key performance indicators that convey how well an organization is performing. • Dashboards include graphics, text, colors, and hyperlinks. All content is displayed in a role-based, secure, customizable, and extensible environment.