Download
1 / 41
410 likes | 571 Vues
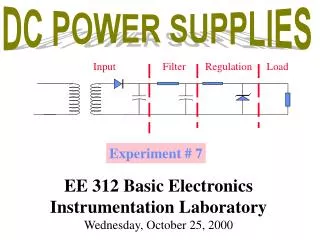
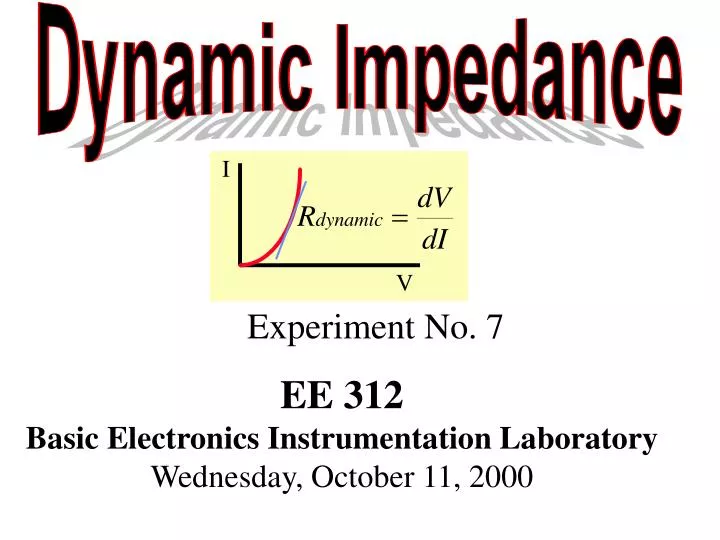
I. V. Experiment No. 7. EE 312 Basic Electronics Instrumentation Laboratory Wednesday, October 11, 2000. Objectives:. Measure dynamic impedance of a forward-biased diode & Zener diode Learn about small-signal techniques

E N D
I V Experiment No. 7 EE 312 Basic Electronics Instrumentation Laboratory Wednesday, October 11, 2000
Objectives: • Measure dynamic impedance of a forward-biased diode & Zener diode • Learn about small-signal techniques • Learn about interference reduction through the use of proper grounding and twisted-pair techniques
Background: What is dynamic impedance ? V I resistance R= dV d I rd = dynamic resistance
I I I R V V V I V V I V-I Characteristics diode transistor rd Tube slope I Operating Point dV dI V R=
iD slope diD /dvD vD dvD Vd VD rd = = = iD Id diD Id Vd
IEEE Standard Notation ID id + ~ dc circuit ac circuit - iD Id id X d or D ID iD iDtotal diode current ID dc diode current id ac diode current Id ac amplitude
VD vD vd + ~ dc circuit ac circuit - vDtotal diode voltage Vd vd VD dc diode voltage VD vD vd ac diode voltage Vd ac amplitude
Small-Signal Condition Id, Vd ID, VD
Dynamic Resistance Measurement iD Vd I d rd = 2Id ID 2Vd VD vD
Input Signal Too Large iD ID VD vD
Input Signal Too Small iD ID VD vD noise
noise Measurement of rd looks simple. The problem is that vd in the millivolt range for forward bias. Thus, noise and stray pickup may cause trouble if you are not careful.
! Oscilloscope R id A B Stray magnetic flux Questions: Where does come from ? Example: How large is it ?
Questions: Where does come from ? Answer: 1. Current iac in power lines on bench & drops from ceiling 2. fluorescent lights 3. AC machines r
Question: How large is ? I r r
Oscilloscope R 2 Area=1 m A B 1 meter Assume our experiment is about 2 meters from the power lines: r = 2 m 100 amp. peak 60 HZ Peak value is 3.77 mV and this may be comparable to signal amplitudes being measured!
+ ~ - Must be concerned about in all parts of circuit.
OSC. How is this problem avoided? remember We have control over A. We can‘t do much about r or I. So, we must minimize A. Step 1: Make the area small Step 2: Twist wires together OSC.
Twisting wires does two things, 1- Holds wires together 2- voltages induced in adjacent sections cancel V1 V2 1 2 V1~ -V2 So induced signals cancel
Keep track of grounded leads Oscilloscope R A B
Single Point Grounding Use Only One Ground Connection Such As CRO ground
Can only one ground connection be realized? e. g. CRO ground. Not with BNC’s because the each outer connector is another ground.
Capacitive Coupling1. Assume 1 pF between your circuit and 120 VAC power lines.2. 60-Hz current I = jCV where = 377 rad/s at f = 60 Hz, C = 1 pF, and V = 120 VAC(rms)
3. The voltage produced by I = ZxI where Z is the impedance I flows through. 4. Example: CRO Z = 1 Meg VCRO = 377x1pFx120Vx1Meg = 45 mV(rms) = 130 mVpp
Procedures: • I- Measure dynamic resistance of a Zener diode in the forward bias region. • II- Simulation for Part I. • (In Bell 242) • III- Measure dynamic resistance in the Zener breakdown region.
Components: • Zener Diode 1N4742-12VDC-0.5 W • 2 Heathkit Resistance Substitution Boxes • 1-kohm & 10 kohm Resistors • Decade Capacitor Box
CH. 1 CH. 2 C R1 R2 A ID id + ~ 0-20V dc circuit ac circuit - vD, iD 1- Dynamic Resistance in Forward Region
~10 VDC A R1 + ~10.4V to ~10.8V ID ~ ~0.4 to 0.8V - dc circuit The values of R1 and the voltage source are selected to control the dc bias current ID. Suppose we want ID = 10 mA. Make the dc voltage across R1 = ~10 VDC. Assume VD = 0.7 V. V=10.7 volts & ID =10 mA R1=1000 Ohms
R2 is selected so that ac current peak is ~10% of dc current. R1=1000 Ohms R2=10,000 R1 C R2 A id + ~ ~10.7V ac circuit - ~20Vpp 1 kHz By setting the dc power supply voltage to ~10.7 VDC & the FG amplitude to ~20 Vpp and R2 to ~10R1, the ac current peak is ~10% of dc current. I. E. ID =10 mA & id =1 mA . To obtain other values of ID & id change both R1 & R2 with R2/R1 = ~10. The dc & ac voltage levels in the circuit change very little as R1 & R2 are changed to change the currents ID & id .
R2 is selected so that ac current peak is ~10% of dc current. R1=1000 Ohms R2=10,000 C R2 A id + ~ ~10.7V ac circuit - ~20Vpp 1 kHz C blocks dc current in the ac circuit & C should be large enough so that capacitance reactance is small compared with R2 Note that R1 must be >> diode dynamic resistance so that most of the ac current goes through the diode & not the dc circuit
Selection of R2 • The values of R2 and the function generator voltage amplitude Vgen should be chosen to make the ac current amplitude id 10% to 20 % of ID. The corresponding diode peak ac voltage Vd will be 10% V to 20 % of nVT where VT = 25 mV at T = 290 K. (~20 C). Thus Vd will be 2.5 to 5 mV for n = 1 and the peak-to-peak diode ac voltage will be 5 to 10 mV.
rtheoretical ? n=1 to 2
n? d(lnID) dVD slope gives n 1/T
Examples: ID = 0.2 mA n = 1 rd = 1X25mV/0.2mA = 125 n = 2 rd = 2X25mV/0.2mA = 250
2 3 4 1 C R1 R2 + ~ D1 0-20V - 0 2- Simulation a- Simulate Part 1 of experiment b- Plot I(D1) and V(2) on separate graphs c- Calculate dynamic impedance of the diode
2 3 4 1 C R1 R2 + ~ D1 0-20V - 0 [mA] DYNAMIC IMPEDANCE I1 0 1 PWL(0 .5M .00249 .5M .0025 1M .00499 1M .005 5M .00749 5M .0075 10M) R1 1 2 1.5K D1 2 0 DIODE .MODEL DIODE D((RS=2 IS=2E-9 N=1.8) R2 3 2 15K C1 4 3 .22U V1 4 0 SIN(0 5 1KHZ) .TRAN .05M 10M 0 .05M .PRINT TRAN V(2) i(D1) .END time [s]
CH. 1 CH. 2 C R1 R2 A ID id + ~ 0-20V dc circuit ac circuit - vD, iD 3- Dynamic Resistance of Zener in the Breakdown Region Choose values of dc bias current so that the dc power dissipation in the diode is less than 1/2 of its max rated power dissipation (1/2 Watt).
Assume Zener Diode Breakdown Voltage VZ = 12V The values of R1 and the dc voltage source are selected to control the dc bias current ID. Suppose we want ID = 10 mA. Make the dc voltage across R1 = ~5 VDC. Then R1 = ~5 VDC/10mA = 0.5 k. Use the closest value which is 470 . The FG peak voltage is set at 10 V. The value of R2 is selected so that the peak ac current = 10% of the dc current = 0.1 X 10 mA. Thus R2 = ~10V/1mA = 10 k.