Download
1 / 54
540 likes | 680 Vues
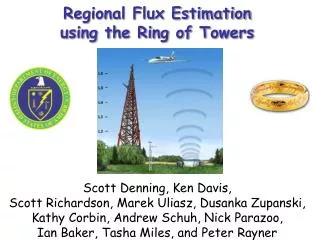
Ninth Symposium on Integrated Observing and Assimilation Systems for the Atmosphere, Oceans, and Land Surface - 2005 AMS Annual Meeting 9-13 January, 2005, San Diego, California. Modeling framework for estimation of regional CO2 fluxes using concentration measurements from

E N D
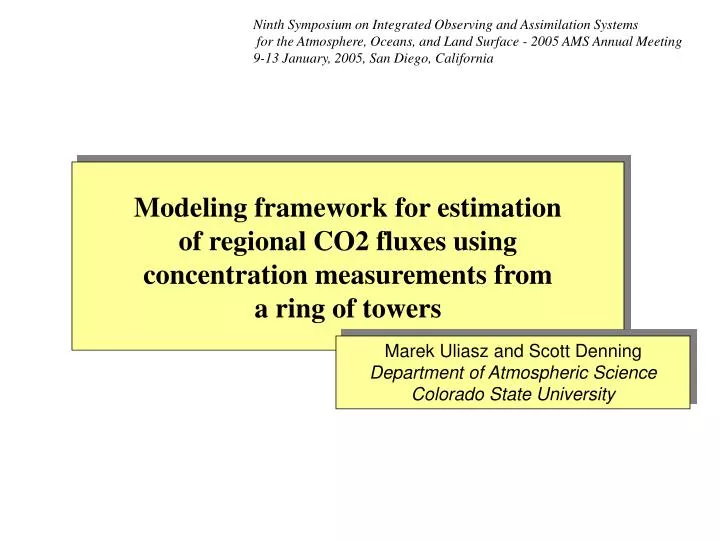
Ninth Symposium on Integrated Observing and Assimilation Systems for the Atmosphere, Oceans, and Land Surface - 2005 AMS Annual Meeting 9-13 January, 2005, San Diego, California Modeling framework for estimation of regional CO2 fluxes using concentration measurements from a ring of towers Marek Uliasz and Scott Denning Department of Atmospheric Science Colorado State University
370 ppm Atmospheric CO2 South Pole Flask Data NOAA/CMDL (2001) Over the past 420,000 years atmospheric CO2 has varied between 180 and 280 parts per million, with concomitant swings of 10° C in the Earth’s climate. Since the Industrial Revolution, CO2 has risen dramatically, with an observed warming of 0.5°C in the past 100 years. Law Dome ice core Etheridge et al (1999) Vostok (400k yr) Ice Core data (Petit et al, 1999)
OUTLINE • Atmospheric CO2 data • Modeling framework for regional inversions • The ring of towers campaign • Example of CO2 flux estimation using pseudo-data • Modeling approach to CO2 analysis • Cold front passage • Lake signature
Orbiting Carbon Observatory(Planned August 2007 launch) • Estimated accuracy for single column ~1.6 ppmv • 1 x 1.5 km IFOV • 10 pixel wide swath • 105 minute polar orbit • 26º spacing in longitude between swaths • 16-day return time
The Ring of Towers = 40m Sylvania flux tower with high-quality standard gases. = LI-820 sampling from 75m above ground on communication towers. = 447m WLEF tower. LI-820, CMDL in situ and flask measurements. data provided by Ken Davis, Scott J. Richardson and Natasha Miles, The Pennsylvania State University
modeling framework global transport inflow fluxes CSU RAMS regional meteorology SiB LPD model atmospheric transport source-receptor matrix data analysis influence functions Bayesian inversion estimation of regional CO2 fluxes
modeling framework CSU RAMS regional meteorology SiB LPD model atmospheric transport source-receptor matrix data analysis influence functions Bayesian inversion estimation of regional CO2 fluxes Ensemble Data Assimilation Maximum Likelihood Ensemble Filter
modeling framework Parameterized Chemical Transport Model (PCTM) global transport inflow fluxes CSU RAMS regional meteorology SiB LPD model atmospheric transport source-receptor matrix data analysis influence functions Bayesian inversion estimation of regional CO2 fluxes Ensemble Data Assimilation Maximum Likelihood Ensemble Filter
Climatology of influence functions for August 2000 • influence functions derived from RAMS/LPD model simulations • passive tracer • different configurations of concentration samples - time series from - a single level of WLEF tower - all levels of WLEF tower - WLEF tower + six 76m towers
Example of estimation of NEE averaged for August 2000 • Bayesian inversion technique using influence function derived from CSU RAMS and Lagrangian particle model • flux estimation for source areas in polar coordinates within 400 km from WLEF tower (better coverage by atmospheric transport) • NEE decomposed into respiration and assimilation fluxes: R=R0, A=A0 f(short wave radiation, vegetation class) • inversion calculations for increasing number of concentration data (time series from towers) • NEE uncertainty presented in terms of standard deviation derived from posteriori covariance matrix • inflow CO2 flux is assumed to be known from a large scale transport model in further work, concentration data from additional tower will be used to improve the inflow flux given by a large scale model Configuration of source areas with WLEF tower in the center of polar coordinates
modeling approach to CO2 data analysis Cold front passage across the ring
CO2 from 5 sites, April 29, 2004 1200UTC Ken Davis, Scott J. Richardson and Natasha Miles The Pennsylvania State University
[10-10 x sm-3 ] sunset
[10-10 x sm-3 ] sunrise
seasonal cycle of CO2 flux at WLEF tower
seasonal cycle diurnal cycle of CO2 flux at WLEF tower
modeling approach to CO2 data analysis Lake signature in CO2 data
influence function: August 2003 entire domain
influence function: August 2003 entire domain land
influence function: August 2003 entire domain land water
Relative contribution of different source areas to tracer concentrations at 400m WLEF tower May-November 2003 land 85.4% Lake Superior 9.5% Lake Michigan 1.8% other waters 3.1%
Relative contribution of different source areas to tracer concentrations at 400m WLEF tower May-November 2003 land 85.4% Lake Superior 9.5% Lake Michigan 1.8% other waters 3.1%
Relative contribution of different source areas to tracer concentrations at 400m WLEF tower May-November 2003 land 85.4% Lake Superior 9.5% Lake Michigan 1.8% other waters 3.1%
Relative contribution of different source areas to tracer concentrations at 400m WLEF tower May-November 2003 land 85.4% Lake Superior 9.5% Lake Michigan 1.8% other waters 3.1%
Relative contribution of different source areas to tracer concentrations at 400m WLEF tower May-November 2003 land 85.4% Lake Superior 9.5% Lake Michigan 1.8% other waters 3.1%