Download
1 / 19
190 likes | 200 Vues
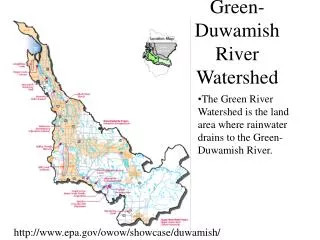
GRUWUT January 2014 Green River Modeling. GRUWUT January 2014 Green River Modeling. Two models: Reclamation’s Green River RiverWare model (monthly timestep) Utah DWRe’s MODSIM Green River (daily timestep) model Reclamation runs two depletions scenarios:

E N D
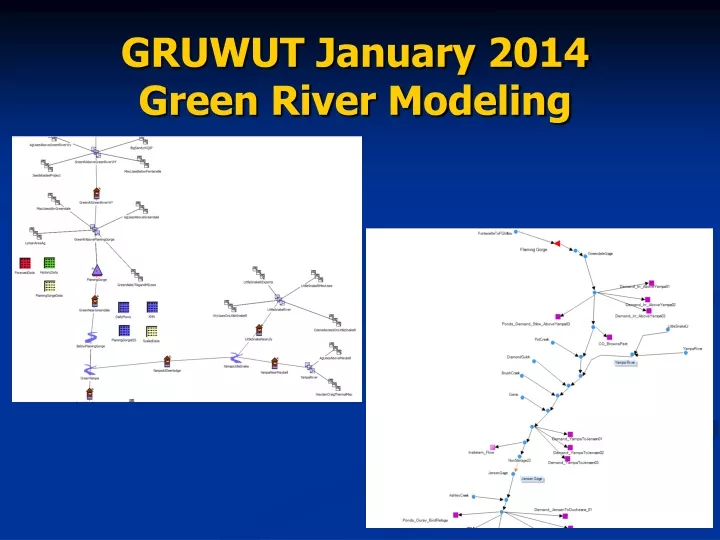
GRUWUT January 2014 Green River Modeling • Two models: • Reclamation’s Green River RiverWare model (monthly timestep) • Utah DWRe’s MODSIM Green River (daily timestep) model • Reclamation runs two depletions scenarios: • Colorado River Basin Study Scenario A “Current” (2012) and “Future” (2060) • Flaming Gorge Releases and Yampa Inflows are then output for input into DWRe’s MODSIM Green River MODSIM model (as most upstream inflows)
Reclamation’s Green River RiverWare Model • Reclamation’s monthly model output is disaggregated to daily for MODSIM input: • Baseflow period daily flows are held constant through the month • Peak Flows are disaggregated: • Yampa by historical patterns • FG Releases per model rule logic (max release, ramp up/down rates...)
Utah’s MODSIM Model • Includes daily historical tributary inflows, diversions and return flows throughout the Green • Four depletion scenarios modeled: • Current All • Current CO & WY, Future UT • Future All • Future CO & WY, Current UT
Depletions Overview • CO & WY: From Reclamation’s Colorado River Basin Study Scenario A, and • UT: from Utah DWRe’s Water Rights & Depletion Summary
Hydrologic Classifications Spring flow period = May through July; Baseflow period = August through February; March & April not included in analysis
Greendale Baseflow High end of target range (mod wet) Low end of target range (mod wet) Note: Avg, Mod Dry & Dry all have low range target of 800 cfs
Additional Depletions in Vicinity of Green River Compare datasets within circles to see the impact of additional depletions in the vicinity of Green River gage.