Download
1 / 22
230 likes | 373 Vues
Modelling N and P retention in wetlands- the effect of planned wetlands within the catchment of the river Tullstorpsån. Master thesis by Jan Petersson Linnaeus University Kalmar River Basin District Authority for the Southern Baltic Sea Sweden. 2011-02-03 WAB-meeting in Sopot, Poland.

E N D
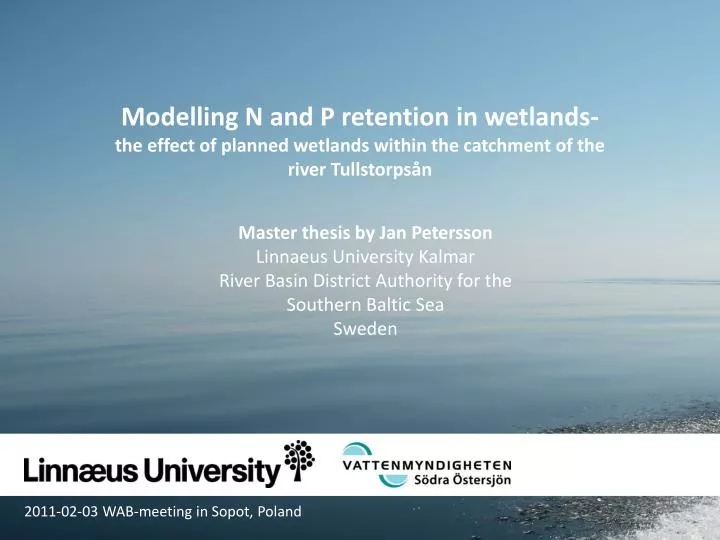
Modelling N and P retention in wetlands- the effect of planned wetlands within the catchment of the river Tullstorpsån Master thesis by Jan Petersson Linnaeus University Kalmar River Basin District Authority for the Southern Baltic Sea Sweden 2011-02-03 WAB-meeting in Sopot, Poland
Background • The Swedish River Basin District Authorities • Responsible for the coordination and implementation of the Water Framework Directive in Sweden • Good status for all waters until 2015 (surface waters as well as ground water) • 5 districts, natural borders – marine basins Bothnian bay water district Bothnian sea water district North baltic water district Skagerrak and Kattegat water district South Baltic water district
Surface waters with eutrophication problems Cost effective measures Reduction versus investment All costal areas 1/3 of all inland waters $ Kg Background Bothnian bay water district Bothnian sea water district North baltic water district Skagerrak and Kattegat water district South Baltic water district
Modeling Project • Hydrologi and Water Quality models • 5 pilot areas • Describes tot-N and tot-P losses from land to the ocean • Effectiveness of measures Söderköpingsån Svartån Öland Main Goal Provide basic information for the realization of more detailed programs of measures to reduce eutrophication in rivers and lakes. Lyckebyån Coastal area Skåne
Meteorological data Precipitation Temperature Evaporation Waterflow N- and P sources Diffuse- & Point sources N & P conc. N P N P N P Calibration N P N P Transport and retention N P MIKE BASIN Hydrology, NAM Load Calculator, LC Water Quality, WQ
Mathematical modells for N and P retention in wetlands (Wittgren et al. 2001; Tonderski et al. 2005) • Differential equations • Calibrated against real wetlands in the southern part of Sweden. • Retention dependent on: • Water flow • Water temperature • Incoming N- & P conc. • Wetland area • Wetland volume Background Wetlands as a measure to reduce the N and P load • Limited knowledge of the effectiveness • Literature review (2004) • N: ~30 – 3000 kg/ha/year • P: ~5 – 700 kg/ha/year • Positive influence on the retention • High nutrient load per unit area • High concentration + moderate water flow
Background MIKE BASIN Mathematical modells for N and P retention in wetlands (Wittgren et al. 2001; Tonderski et al. 2005) River Basin District Authority´s Hydrologi and water qualitymodel Costal area of Skåne Effect on N and P load from the catchment of Tullstorpsån
Background Catchment of the river Tullstorpsån and planned wetland locations • 49 wetlands (area: 0,2 – 5 ha) • Part of a larger initiative from local farmers and Trelleborg municipality The Tullstorpsåproject • Overall goal: • Reduce nutrient leakage • Good ecological status • Reduce flooding • Facilitate management • Reduction of nutrients • N: 30 % • P: 50 % Planned wetland locations Nr
Water flow • N & P concentrations Potential retention N &P Methodology MIKE BASIN Mathematical modells for N and P retention in wetlands (Wittgren et al. 2001; Tonderski et al. 2005) River Basin District Authority´s Hydrologi and water qualitymodel • Differential equations • Calibrated against real wetlands in the southern part of Sweden. • Retention dependent on: • Water flow • Water temperature • Incoming N- & P conc. • Wetland area • Wetland volume Costal area of Skåne
Limitations • Only 22 out of 49 wetlands included • Wetlands located outside the defined catchment of Tullstorpsån in MIKE BASIN • The methodology can’t include the effect upstream/downstream wetlands Final configuration in MIKE BASIN Methodology Estimation of catchments • Data from the municipality of Trelleborg (field and map studies) • Estimation via topographical data within the model (resolution 50x50 m) Wetland catchments Catchments defined by Trelleborg
Methodology Estimation of catchments • Data from the municipality of Trelleborg (field and map studies) • Estimation via topographical data within the model (resolution 50x50 m) Wetland catchments Catchments defined by Trelleborg • Limitations • Only 22 out of 49 wetlands included • Wetlands located outside the defined catchment of Tullstorpsån in MIKE BASIN • The methodology can’t include the effect upstream/downstream wetlands Final configuration in MIKE BASIN
Results • Catchments: 11 - 442 ha • Simulated Water flow: 70 – 2700 m3 d • Mean residence time: 2 – 206 days (mean 21 d)
P 0,2 – 0,3 mg L (mean 0,21) Results Simulated concentrations N 5 – 9 mg L (mean 7,1) Measured 1990-2006 Mean: 8,6 mg L Measured 1990-2006 Mean: 0,16 mg L
Results Calculated retention N P Specific 60 – 600 kg ha y (mean 270) Relative 4 – 70 % (mean 13 %) Specific 2 – 20 kg ha y (mean 12) Relative 7 – 80 % (mean 35 %) • Literature review • 30 – 3000 kg ha y • Arheimer & Wittgren (2002) • 60 – 500 kg ha y • Literature review • 5– 700 kg ha y • Tonderski, Arheimer & Pers (2005) • 4– 15 kg ha y
Simulated wetlands (17 ha) + other (57 ha) N reduction: 11300 kg, 12 % P reduction: 570 kg, 38 % • The Tullstorpså project • Nutrient reduction goal: • N: 30 % • P: 50 % Results Effect on the total N & P load from the catchment of Tullstorpsån Total simulated load from the catchment of Tullstorpsån: 94000 kg N, 1500 kg P
Optimization • Possibility to optimize the retention? • The hydraulic load (eg. water load per unit area) important factor • High values combined with high concentrations positive for the retention • but to high risk of resuspension of sediments and leakage of nutrients • The wetland P-retention model • Includes this information, when • Water Volume in > wetland volume no retention • The wetland N-retention model • Doesn’t include this, but its recommended that the retention time should be greater than 2 days • Optimization • Adjustment of the wetland area (effects the hydraulic load and the retention time)
Reduction of total load N: 3400 1900 kg P: 160 80 kg Mean reduction per ha N: 270 470 kg P: 12 19 kg ~60 % increase >50 % decrease Optimization- results • Substantial reduction of the wetland area • total simulated wetland area decreased with > 70 % More effective retention, if the wetlands were smaller but at the same time greater in number
Discussion The result should be viewed as general guide lines • MIKE BASIN • Assumption within the model • Input data to the model Uncertainties • Wetland retention models • No consideration for • The wetland design (except area and volume) • Plant composition
Summary • The planned wetlands… • Have the potential to reduce large amounts of N & P from Tullstorpsån • Could be optimized with respect to there hydraulic load • Smaller but in greater numbers more effective reduction of N & P
Thanks for your attention! jan.f.petersson@lansstyrelsen.se