Download
1 / 21
260 likes | 622 Vues
Metrics That Matter Learning Analytics. The standard in Learning Measurement. Metrics That Matter Learning Analytics. Web-enabled automated learning evaluation process Post-class, follow-up and bespoke surveys Detail, summary and management reporting

E N D
Metrics That MatterLearning Analytics The standard inLearning Measurement
Metrics That MatterLearning Analytics • Web-enabled automated learning evaluation process • Post-class, follow-up and bespoke surveys • Detail, summary and management reporting • Internal and external benchmark comparisons • Analysis tools • Gives a better insight into training’s Key Performance Indicators • Demonstrate the business value of training • Improve performance of the enterprise • Better use of training resources and budgets • Increase support from across the enterprise for training
MethodKirkpatrick methodology and Phillips ROI layer… model shows an IIP ‘Level 0’ layer Did they like it?Course content, instructors, course materials venue, LMS experience, etc Level 1 Did they learn? Test knowledge, intentions, relation to own situation, application Level 2 Level 0 Level 3 Do they use it? Time to job impact, level of job impact, barriers to use provided to managers > > > Learning objectivesManager completes with delegate What were the results? Sales, services, quality, cycle time, errors,timescale, etc Level 4 What’s the ROI? Financial return, timescale, value, human capital value Level 5 Needed by managers > > >
Automated process Data Collection Data Storage Data Processing Data Reporting Post Event Survey Follow Up Survey Manager Survey Instructor Survey Scored Testing Needs Assessments Phillips ROI Input Templates Paper, web, email LMS Integration ASP solution SQL Server Centralized storage Secure environment Raw data access Sophisticated queries OLAP technology Multiple aggregations Multiple cuts / views • Web-enabled reports • Push email alerts • Phillips ROI report • Custom query • Custom reports • Analytical tools • Forecast calculator Automated Valued time Because data collection, processing and reporting is automated, you have more time to analyze the data and turn it into actionable business intelligence
Client A Client B Client C Client D Client E Comparative performance/standard reports
Performance to goals reports Allows you to establish pre-set goals for each question category on the Post event and Follow up surveys and compare them to actual performance.
Customer Wade Media Tonnell Grp JKT North Paris Textile Qamoli Dent Morcam Nottingham Aberdeen Chester London Norwich Liverpool Top/bottom report
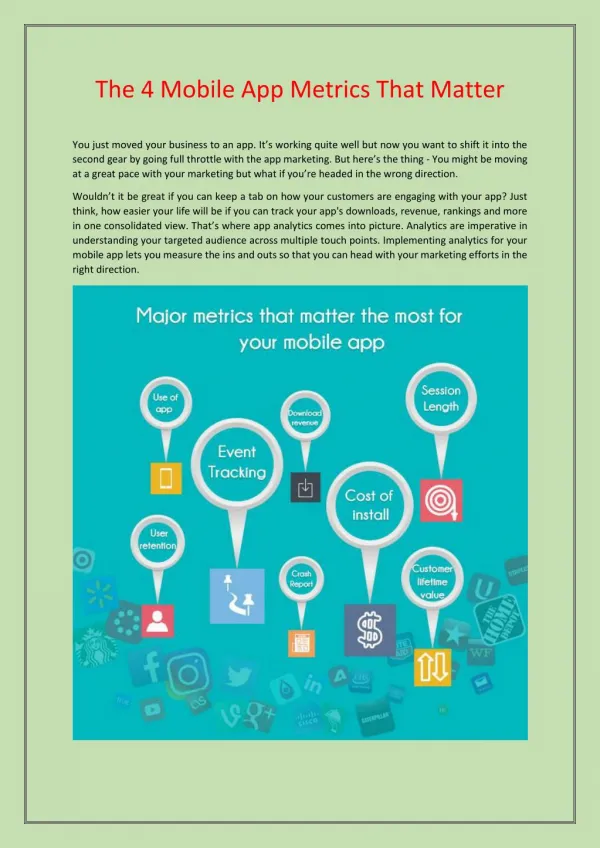
What percent of skills were applied to the job? This indicator provides insight into the amount of new knowledge/skills picked up in the training for each course (or curriculum or program) that the participant directly applied when they went back on the job as the data is collected several months after the training when the participant is back on the job. When is the time to job impact? This lets you know if and when training was applied to the job. It is collected months after the training, automatically by Metrics that Matter. It helps the organization understand when training effects the job, if at all. How much more productive are employees? You can track specific business results, such as productivity. Asking a manager or a participant to estimate productivity once time has passed on the job is a good indicator of learning’s impact to a specific business objective.
ROI Score cardThe scorecard is a great management tool to showcase value to key stakeholders. This report shows you each level of learning and the Key Performance Indicators within each level. Level five shows quantitative ROI metrics including: Benefit to Cost Ratio Payback Period ROI%
Push Email Reporting Allows you to setup reports to be sent to you via email at anytime you desire so you do not have to go into MTM to retrieve your favorite reports.
Phillips ROI Toolset in MTM A summary of the ROI Methodology to use as a reading reference Examples of case studies applying the Phillips ROI Methodology A list of selected publications of Jack and Patti Phillips The authorized Phillips End of Program Data collection instrument The authorized Phillips Follow Up Data collection instrument The authorized Phillips Cost Calculation Template The authorized Phillips Follow Up Data collection instrument KnowledgeAdvisors will be working with Jack and Patti Phillips to continue adding additional tools with each quarterly update to the Metrics that Matter software!
Contact Information • For further information on Metrics that Matter please contact: New Wave Learning 4a Flemming Court, Glasshoughton Castleford, West Yorkshire.WF10 5HW Tel: 01977 628980 Email: info@newwavelearning.co.uk Website: www.newwavelearning.co.uk