Download
1 / 51
520 likes | 1.01k Vues
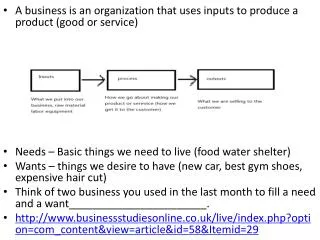
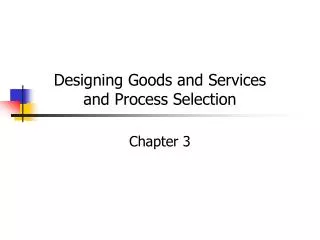
Lesson 07 Process Selection & Capacity Planning. Process selection refers to the way an organization chooses to produce its goods or services . Inputs. Process. a series of actions or operations that transforms inputs into outputs. Feedback. Operation A. Operation B. Outputs.

E N D
Lesson 07 Process Selection & Capacity Planning Process selection refers to the way an organization chooses to produce its goods or services
Inputs Process a series of actions or operations that transforms inputs into outputs Feedback Operation A Operation B Outputs
Components of Process Selection Capacity Planning Facilities/Equipment Work Design Forecast Product and/or Service Design Technology ProcessSelection
Factors In Process Selection Decisions . Make vs Buy - utilize internal capacity, subcontract, purchase sub-components based on ..cost .. available capacity..expertise..qualityconsiderations .. nature of the demand (e.g. high or low, short or long range) .. speed .. reliability . Capital Intensity - the mix of equipment and labor . Process flexibility
Types of Processes Continuous - a system that produces highly uniform products (e.g. chemicals, paper, photographic film, steel) Repetitive - a semi-continuous system which produces output that may be similar but not identical (e.g. electronics, automobiles, computers) Intermittent - usually lower volume output with greater variety in both product and processing ..batchprocessing - produces moderate volumes of similar items (e.g. ice cream manufacturing - strawberry then vanilla) ..jobshop - produces a unit or small volumes of units to meet customer specifications (e.g. machine shop) Projects - non-routine jobs
Heavy Equipment Automobile Assembly Sugar Refinery Product Process Matrix Commercial Printer
Automation Automation refers to machinery that has the ability to sense and control devices that enable it to operate automatically (e.g. CAM, numerically controlled (N/C) machines , robots, Computer Integrated Manufacturing (CIM))
Capacity Planning Capacity is the upper limit or ceiling on the load that an operating unit can handle. There are many questions that must be answered and the the detail required to answer each will depend on whether the demand is short, intermediate or long range. .What kind of capacity is needed? - depends on the products/services that management intends to produce or provide .How much is needed? .When is it needed? – depends on the stage of completion of a product/service
Capacity Decisions Capacity decisions . have a real impact on the ability of an organization to meet future demands for products/services . affect operating costs - too much can sometimes be as bad as too little . are usually a major determinant of initial cost . involve long tem commitment of both financial and human resources - once implemented, it may be very costly to modify capacity decisions without major costs . can affect competitiveness - the ability to quickly add or utilize unproductive capacity may serve as a competitive advantage
DesignCapacity - refers to the maximum output that can possibly be attained EffectiveCapacity - refers to the maximum output given product mix, scheduling difficulties, quality factors, and other doses of reality ActualOutput - refers to the rate of output actually achieved (can not exceed the Effective Capacity) Capacity Concepts
Actual Output Actual Output Efficiency = Utilization = Effective Capacity Design Capacity Measures of Capacity Effectiveness
Improving Utilization Utilization can be improved by improving effectivecapacity. Some of the factors which influence effective capacity are: .facilities - design, location, layout, environment .products/services - design, product/service mix .processes - quantity and quality capabilities .humanconsiderations - job content, job design, training and experience, motivation, learning rates, absenteeism, turnover .operations - scheduling, materials management, quality assurance, maintenance policies, equipment breakdowns .externalforces - product standards, safety regulations, unions, pollution control standards
Growth Determining Capacity Requirements Forecasts - are necessary to determine demand. They can identify trends and seasonality. Statistical analysis of historical forecast accuracy can be very useful in identifying demand variability and establishing upper and lower bounds for capacity requirements. Mathematical/Computer models and simulations (based on probability distributions describing variability in demand) can be developed to analyze capacity requirements. For example: How many elevators are needed in a new building? How many tellers are needed at a bank? How can you evaluate a railroad’s throughput?
Developing Capacity Alternatives Whendeveloping capacity alternatives youshould . design “flexibility” into systems - provision for future expansion in original designs can be cost effective at the time the increases are necessary (e.g. a plan for 9 hole golf course may include systems big enough to handle a future 18 hole course) . “big picture” approach - consideration for other issues affected by capacity increases/decreases (e.g. extra parking space, extra staff, impact on suppliers, etc.) . attempt to “smooth” capacity requirements - look for complimentary demand patterns (e.g. one up while anotherdown) and consider “trade-off” alternatives (e.g. overtime,“make ahead”, etc.)
Developing Capacity Alternatives (cont’d) .prepare for capacity “chunks” - capacity is often increased in large increments even though demand changes steadily (e.g. a machine produces 40/hr; when demand is 35 you have 5 excess; when demand goes to 45 capacity goes to 80/hr and you have 35 excess which could create excesscosts) . identify the “optimal” operating level - may vary by size of plant
Total annual processing time needed = 5800 Evaluating Capacity - Example Example 2: A department works one 8-hour shift, 250 days per year. The following products are all made on the same machine. How many machines will be needed to meet the demand? Number of hours in a manufacturing year = 8*250 =2000 Number of machines = 5800/2000 = 2.9 or 3 machines.
Cost Volume Analysis Accounting Standards have been established to ensure that businesses classify cost appropriately. Generally these costs are described by: . Fixed Costs - those which do not vary with the volume of units produced (e.g. building rent, property taxes, management salaries) . Variable Costs - those costs that are directly related to the volume of units produced (e.g. raw materials, direct/indirect labor, packaging materials) . Step Fixed Costs - when production units increase beyond a certain point additional fixed expenses may occur (e.g. - capacity chunks, another building, more equipment, etc.)
Cost Symbols & Relationships FC = Fixed Costs Q = Quantity Produced VC = Variable Cost per unit TVC = Total Variable Cost = VC*QR = Revenue per unit TR = Total Revenue = R*Q TC = Total Costs = FC + VC*QP = Profit= TR - TC = R*Q - (FC + VC*Q) = Q*(R-VC) -FC Note: various other formulas can be generated by using these mathematical relationships.
35000 30000 25000 20000 15000 10000 5000 0 -5000 -10000 0 1000 2000 3000 4000 5000 FC Bakery - Fixed Costs Example 3: A bakery makes pies with the following monthly costs. FC = Fixed Costs = $6,000, VC = Variable Cost per pie = $2, R = Revenue per pie = $7. Plot the problem on a graph. First , plot the fixed costs on the graph.
35000 30000 25000 20000 15000 10000 5000 0 -5000 -10000 0 1000 2000 3000 4000 5000 FC TVC Bakery – Total Variable Costs (TVC) Example 3: A bakery makes pies with the following monthly costs. FC = Fixed Costs = $6,000, VC = Variable Cost per pie = $2, R = Revenue per pie = $7. Plot the problem on a graph. Next , plot the total variable costs on the graph.
35000 30000 25000 20000 15000 10000 5000 0 -5000 -10000 0 1000 2000 3000 4000 5000 FC TVC TC Bakery – Total Costs (TC) Example 3: A bakery makes pies with the following monthly costs. FC = Fixed Costs = $6,000, VC = Variable Cost per pie = $2, R = Revenue per pie = $7. Plot the problem on a graph. Next , plot the total costs on the graph.
35000 30000 25000 20000 TR=TC 15000 10000 5000 0 P = 0 -5000 -10000 0 1000 2000 3000 4000 5000 Break Even Point (BEP) FC TC TR Bakery – Total Revenue( TR) Example 3: A bakery makes pies with the following monthly costs. FC = Fixed Costs = $6,000, VC = Variable Cost per pie = $2, R = Revenue per pie = $7. Plot the problem on a graph. Next , plot the total revenue on the graph.
35000 30000 25000 20000 Profit Amount 15000 10000 5000 Loss Amount 0 -5000 -10000 0 1000 2000 3000 4000 5000 Break Even Point (BEP) FC TC TR Bakery – Profit & Loss Example 3: A bakery makes pies with the following monthly costs. FC = Fixed Costs = $6,000, VC = Variable Cost per pie = $2, R = Revenue per pie = $7. Plot the problem on a graph. Loss Profit
Break Even Point (BEP) The Break Even Point is the quantity where Total Revenue (TR) and Total Costs (TC) are the same. We can use the relationships to solve for the quantity where TR and TC are the same. TR = TC R*Q = FC + VC*Q Q = FC/(R-VC)
35000 30000 25000 20000 15000 10000 5000 0 -5000 -10000 0 1000 2000 3000 4000 5000 Break Even Point (BEP) FC TC TR Bakery – Break Even Point Example 3: A bakery makes pies with the following monthly costs. FC = Fixed Costs = $6,000, VC = Variable Cost per pie = $2, R = Revenue per pie = $7. Calculate the break even point. BEP = FC/(R-VC) = 6000(7-2) = 1,200 pies
BEP = FC/(R-VC) = 6000(7-2) = 1,200 pies Calculate the break even point.
P = Q*(R-VC)-FC = 1,000*(7-2)-6,000 = - 1,000 How much profit or loss will the bakery have it sells 1000 pies?
P = Q*(R-VC)-FC = 10000=Q*(7-2)-6,000 Q = 3,200 pies How many pies will the bakery have to sell to make a profit of $10,000. Breakeven Analysis
See if you can figure out the formula. How many pies will the bakery have to sell to achieve a revenue of $60,000.
Step Fixed Costs Costs Quantity Total Costs w/ Step Fixed Costs
Total Costs Costs Quantity Total Costs w/ Step Fixed Costs
Total Costs w/ Step Fixed Costs - Example Example 4: A manager has the option of purchasing 1, 2 or 3 machines. Fixed costs and potential volumes, variable costs and revenue per unit produced are shown below. VC = = $10, R = $40. Draw a graph showing the total costs and revenue over each range.
Total Costs w/ Step Fixed Costs - Example You should verify that you understand this concept by manually graphing the example on a piece of graph paper.
BEP w/ Step Fixed Costs - Example • Example: A manager has the option of purchasing 1, 2 or 3 machines. Fixed costs and potential volumes, variable costs and revenue per unit produced are shown below. VC = = $10, R = $40. • Use the graph on the previous page to visually estimate the breakeven point over each range. • Mathematically determine the actual Break Even Point for each range. BEP 1 Machine = 9,600/(40-10) = 320 units (not in range) BEP 2 Machines = 15,000/(40-10) = 500 units BEP 3 Machines = 20,000/(40-10) = 667 units BEP = FC/(R-VC)
BEP w/ Step Fixed Costs - Example Example: A manager has the option of purchasing 1, 2 or 3 machines. Fixed costs and potential volumes, variable costs and revenue per unit produced are shown below. VC = = $10, R = $40. If the projected annual volume is between 580 and 660 units, how many machines should the manager buy? Let’s look at this problem visually.
BEP w/ Step Fixed Costs - Example BEP 3 machines = 667 Does it appear the manager will make a profit when demand is 660 units? BEP 2 machines = 500 Does it appear the manager will make a profit when demand is 580 units? 580 660 Conclusion: Since annual demand is between 580 and 660 the manager should purchase 2 machines. If 3 machines are purchased all demand will be met; but the company will lose money.
BEP w/ Step Fixed Costs - Example You should verify that you understand this concept by manually calculating the revenue, total cost, and profit at each volume level to verify your visual results. 580 660
For the previous example, note how the data is entered. Breakeven Points are automatically calculated for each range.
Profit of 2,400 Loss of $200 For a demand analysis situation, enter the low and high demand quantities. Low Demand Analysis What is the profit if low demand materializes? High Demand Analysis What is the profit if high demand materializes? You should verify the calculations manually to ensure that you understand all the information this template provides with respect to revenue, costs, and profit.
For the same example, suppose you want to make a profit of at least $2,500 per week. How many machines should you buy? To get a profit of $2,500 requires a volume shown here; therefore, since the demand is between 580 and 660, the manager should buy 2 machines. Why should you not buy 3 machines?
Options Fixed Cost VC/Unit Make 150000 60 Buy 0 80 Evaluating Multiple Alternatives Solved Problem 1: A firm’s manager must decide whether to make or buy a certain item used in the production of vending machines. Making the item would involve annual lease costs of $150,000. Cost estimates for the two alternatives are shown below. Answer the following questions.
Cost graph is automatically displayed for each alternative when information is entered. Can you visually determine what the cost is for buying 12,000 units? Can you visually determine what the cost is for making 12,000 units?
Buy: $960,000 Make: $870,000
At what volume is the manager indifferent to whether he chooses make or buy? 7,500 units What is the cost of each alternative at the point of indifference? $600,000 Over what range should the manage choose each option? (i.e. Which one has the least cost over what range?) Buy: Volume < 7,500 Make: Volume > 7,500 Note: there are no equal signs in the answer. Why?
Notice when the revenue per unit and a volume are entered, profits are displayed rather than costs. The template can also be used to analyze profitability scenarios by entering a revenue per unit.
What is the profit at the point of indifference? $150,000 What is the profit for each alternative if the volume is 12,000 units and the revenue per unit is $100? Make: $ 330,000 Buy: $240,000
Evaluating Capacity – Other Quant Methods Cash flow analysis - refers to the difference between the cash received from sales and other sources (e.g. sale of old equipment) and the cash outflow for labor, materials, overhead, taxes, etc. Present Value - expresses in current terms the sum of all future cash flows of an investment proposal The three most commonly used methods of financial analysis are . payback . present value . internal rate of return


![[Proposed Change to Selection Process]](https://cdn5.slideserve.com/9674749/proposed-change-to-selection-process-dt.jpg)