Download
1 / 38
380 likes | 518 Vues
U.S. Census 2000 Results Age Groups and Households. Minneapolis Community Education, April 20, 2002 Presented by Mark Herzfeld, Principal Planning Analyst, Evaluation Unit Hennepin County Children, Family, and Adult Services Department mark.herzfeld@co.hennepin.mn.us.

E N D
U.S. Census 2000 ResultsAge Groups and Households Minneapolis Community Education, April 20, 2002 Presented by Mark Herzfeld, Principal Planning Analyst, Evaluation Unit Hennepin County Children, Family, and Adult Services Department mark.herzfeld@co.hennepin.mn.us Local Web pages for Census Data (Minneapolis and Hennepin County): http://www.ci.minneapolis.mn.us/citywork/planning/Census2000/index.asp http://www.co.hennepin.mn.us/opd/Census_2000/Censushome.htm http://www.crcworks.org/hennepin/censushome.htm
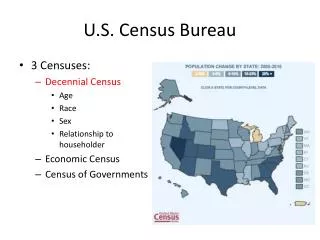
Important Notes About 2000 Census • Official Census Day - April 1, 2000 • Questionnaires sent to every known housing unit in the United States and territories • First time gave choice for multiple races • Hispanic/Latino is counted separately from race • Very complicated to compare racial trends from previous decades
Important Notes About 2000 Census (cont’d) • First release of data for redistricting: total population, adults, race and ethnicity • Release of “short form” data on August 1 2001: detailed age groups, household composition, gender, and housing units • Long-form questionnaire sent to a sample of one-sixth of all housing units • Release of long-form data in Summer 2002: migration, education, language spoken, income, poverty, disability, employment, and more
Census Topics: • Overall Growth in Children and Adults • Distribution of Age Groups • Households and Family Size • Relationships to Householder • General Racial and Ethnic Composition, 2000
Population Density, Minneapolis Communities, 2000 * * * * square miles * * * Per square mile of land
Percent Change in Children Age 0 to 17 and Adults Age 18 and Over, 1990 - 2000 Numbers at top of bars are the numerical increases Mpls. Total 1990 = 368,383 2000 = 382,618
Population by Age, 1990 - 2000, Hennepin County
Number of Persons by Age Group, North Minneapolis Communities, 2000 Total Population Camden = 31,698 Near North = 35,976
Percent Change in Population by Age Group, 1990 - 2000, Hennepin County Labels are for Minneapolis Total Minneapolis Population: 1990 = 368,383 2000 = 382,618
Population of Children Under Age 18, 1990 - 2000, Minneapolis Total Population Age 0 -17 1990 = 75,950 2000 = 84,169
Children Age 0 to 5 as a Percentage of Total Population, U.S. Census 2000 Data displayed by census block groups
Children Age 0 to 5 per Square Mile Minneapolis, 2000 Data displayed by census block groups
Elderly Age 65+ as a Percentage of Population, U.S. Census, 2000 Data displayed by census block groups
Percent of Occupied Housing Units by Tenure, Hennepin County, 2000
Percent of Housing Units by Tenure, Minneapolis Communities, 2000
Average Household and Family Sizes, Hennepin County and Minneapolis, 1990-2000 Minneapolis Hennepin County 1990 2000 Hennepin County Minneapolis
Average Family Size, U.S. Census 2000 Data displayed by census block groups
Relationships to Householder Census Bureau defines householder as the first person listed on the census form.
Percent Change in Number of Children Under 18 by Householder's Relationship, 1990 - 2000, U.S. Census Note: These are rates of change, not the percentages of totals Own Parents
Percent of Total Children Under 18 by Householder's Relationship, 1990 - 2000, U.S. Census Own Parents
Percent of Children Age 0 to 17 Living with Their Single-Parents, Hennepin County, 2000 Data displayed by census block groups Note: These percentages exclude children who are living with unmarried relatives or foster parents.
Children Age 0-17 by Relationship to Householder, Minneapolis, 2000 Hennepin County: 3.2% with grandparents Note: In this chart the family relationships are children living with their own parents or grandparents. Non-parental householders may or may not be married.
Children Age 0-5 by Relationship to Householder, Minneapolis, 2000 Note: In this chart the family relationships are children living with their own parents or grandparents. Non-parental householders may or may not be married. Total Children 0 to 5 = 29,757
Percent Children Age 0-5 by Relationship to Householder, Minneapolis Communities, 2000 Total Children 0 to 5 = 29,757
Elderly Age 65 and Older by Household Type, Hennepin County and Minneapolis, 2000 Total Elderly 65+ : Hennepin County=122,358 Minneapolis=34,878 Suburbs=87,480
Race by Age Groups from the Census • Cannot determine one race plus in combination • with other races for specific ages other than • 0-17, 18 and older • Hispanics/Latinos are categorized as an • “ethnicity”--they are also “double counted” by race • Five percent of Hennepin County children 0-4 • are multi-racial, eleven percent in Minneapolis
Racial Composition of Adults 18 and Over, Minneapolis and Hennepin Suburbs, 2000 Suburban Hennepin County Minneapolis Note: Percentages for each race represent persons who chose only one race.
Racial Composition of Elderly Age 65 and Over, Minneapolis and Hennepin Suburbs, 2000 Suburban Hennepin County Minneapolis Asian/Pac. Islander Other 0.4% 2.4% Two or More American Indian 1.2% 0.8% African American 7.3% White 87.9% White/Non-Hispanic or Latino = 96.9% White/Non-Hispanic or Latino = 87.2% Hispanic or Latino Any Race = 0.4% Hispanic or Latino Any Race = 1.2% Note: Percentages for each race represent persons who chose only one race.
Racial Composition of Children Age 0 to 4, Minneapolis and Hennepin Suburbs, 2000 Suburban Hennepin County Minneapolis White/Non-Hispanic or Latino = 38.2% White/Non-Hispanic or Latino = 78.1% Hispanic or Latino Any Race = 14.3% Hispanic or Latino Any Race = 4.3% Note: Percentages for each race shown here represent persons who chose only one race.
Racial Composition of North Minneapolis Communities, All Ages, 2000 Camden Near North White/Non-Hispanic or Latino = 18.0% White/Non-Hispanic or Latino = 50.0% Hispanic or Latino Any Race = 5.1% Hispanic or Latino Any Race = 3.8% Note: Percentages for each race represent persons who chose only one race.
Change in Hispanic/Latino Population, Minnesota, 1990 - 2000 172.8% Labels are percent change 76.6% Ramsey Total = +13,089, 94.2% Hennepin Total = +31,461, 225.1% 97.9% 167.6% 269.3%
Hispanic/Latino Children Age 0 to 4 Per Square Mile, Minneapolis, 2000 Data displayed by census block groups
Change Per Square Mile in Hispanic/ Latinos Minneapolis, 1990-2000 Data displayed by neighborhood
Percent Elderly of Color Age 65+, U.S. Census 2000 Data displayed by census block groups Note: Those with two or more races are defined as persons of color.
Percent Children of Color, Age 0 to 17, U.S. Census 2000 Data displayed by census block groups Note: Those with two or more races are defined as persons of color.