Download
1 / 9
90 likes | 256 Vues
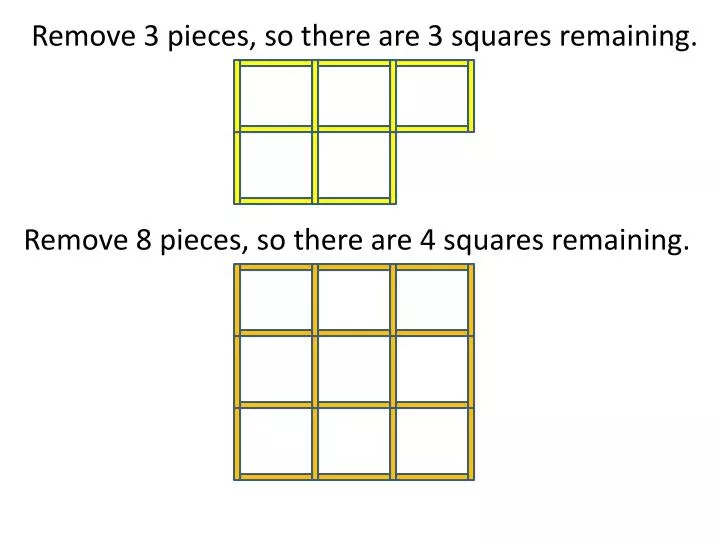
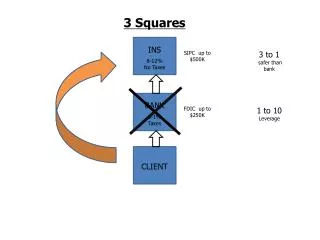
Remove 3 pieces, so there are 3 squares remaining. Remove 8 pieces, so there are 4 squares remaining. What patterns do you notice in the sequence?. Create and draw on your paper, terms 1, 2, 3, 4, 5, and 6. Term 1 Term 2 Term 3.

E N D
Remove 3 pieces, so there are 3 squares remaining. Remove 8 pieces, so there are 4 squares remaining.
What patterns do you notice in the sequence? Create and draw on your paper, terms 1, 2, 3, 4, 5, and 6. Term 1 Term 2 Term 3 How could you determine the number of squares in the model for any term?
Use the models that you just created to complete the table below. Create a scatter plot with terms 1 – 6 and their number of squares on the calculator. UseSTAT and adjust your window to see all the points. What do you notice about the graph? Is it linear?
If this pattern continues what would be the 15th term? If there are 650 squares in the model, what is the term number? 152 + 15 = 240 Right now we can look it up in the table, but later we will solve this by solving the quadratic. n2 + n = 650
Turn the Diagnostics On in your calculator: Press and scroll down to “Diagnostics On”. Press ENTER twice. This will give you the coefficient of determination (r2), which tells you how accurate your line of best fit is compared to your given points. Remember the closer to 1,n 1 = 100% the better the fit! Lets test Linear Regression What equation did you get? What was the correlation coefficient? y = 8x – 9.333333333 r2= .9868 Lets test Quadratic Regression What equation did you get? What was the correlation coefficient? y = 1x2 + 1x + 0 r2 = 1
Let’s look at 1st differences Lets look back at our original table. Find the differences of the squares for each term +4 What do you notice about the numbers being added? +6 +8 If these numbers increased/decreased by the same amount it would be linear. +10 +12
Let’s look at 2nd differences Lets look back at our original table. Find the differences of the differences What do you notice about the numbers? +4 +2 +6 +2 +8 If the second differences are the same, the pattern is called a 2nd degree or quadratic; therefore, this is a quadratic equation. +2 +10 +2 +12
Decide if these patterns are linear or quadratic? How do you know? Then state the equation. 1.) 1, 4, 7, 10, 13, 16, … 2.) -1, 1, 5, 11, 19, 29, … This is a linear and the equation is y = 3x – 2 This is a quadratic and the equation is y = 1x2 – 1x – 1
Decide if these patterns are linear or quadratic? How do you know? Then state the equation. 1.) 3, 12, 25, 42, 63, 88, … 2.) -13, -7, -1, 5, 11, 17, … This is a quadratic and the equation is y = 2x2 + 3x – 2 This is a linear and the equation is y = 6x – 19


![Based on [1], [2] and [3], there are identified:](https://cdn3.slideserve.com/5582210/slide1-dt.jpg)