Download
1 / 1
10 likes | 132 Vues
Stratosphere-Troposphere Coupling: The Stratospheric Seasonal Cycle in CMIP5 Models Robert X. Black 1 , Brent McDaniel 2 and Yun-Young Lee 1 1 Earth and Atmospheric Sciences, Georgia Institute of Technology, Atlanta ; 2 Biology and Physics, Kennesaw State University, Kennesaw, GA.

E N D
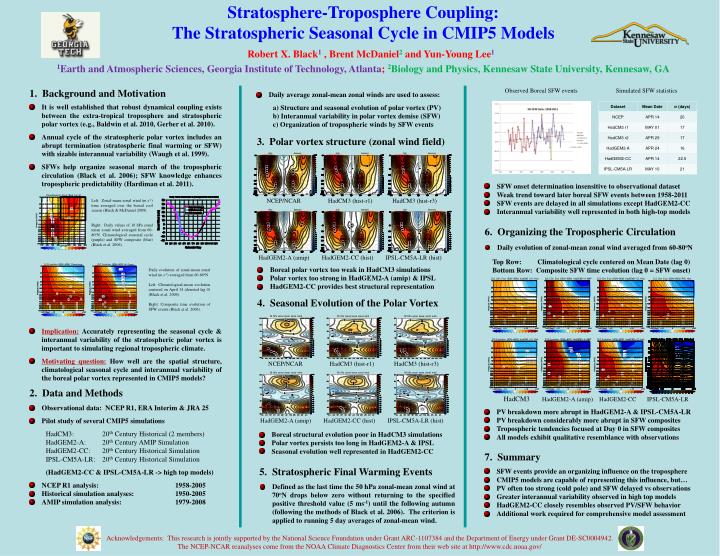
Stratosphere-Troposphere Coupling: The Stratospheric Seasonal Cycle in CMIP5 Models Robert X. Black1 , Brent McDaniel2 and Yun-Young Lee1 1Earth and Atmospheric Sciences, Georgia Institute of Technology, Atlanta; 2Biology and Physics, Kennesaw State University, Kennesaw, GA Observed Boreal SFW events Simulated SFW statistics • 1. Background and Motivation • It is well established that robust dynamical coupling exists between the extra-tropical troposphere and stratospheric polar vortex (e.g., Baldwin et al. 2010, Gerber et al. 2010). • Annual cycle of the stratospheric polar vortex includes an abrupt termination (stratospheric final warming or SFW) with sizable interannual variability (Waugh et al. 1999). • SFWs help organize seasonal march of the tropospheric circulation (Black et al. 2006); SFW knowledge enhances tropospheric predictability (Hardiman et al. 2011). • Implication: Accurately representing the seasonal cycle & interannual variability of the stratospheric polar vortex is important to simulating regional tropospheric climate. • Motivating question:How well are the spatial structure, climatological seasonal cycle and interannual variability of the boreal polar vortex represented in CMIP5 models? • 2. Data and Methods • Observational data: NCEP R1, ERA Interim & JRA 25 • Pilot study of several CMIP5 simulations • HadCM3: 20th Century Historical (2 members) • HadGEM2-A: 20th Century AMIP Simulation • HadGEM2-CC: 20th Century Historical Simulation • IPSL-CM5A-LR: 20th Century Historical Simulation • (HadGEM2-CC & IPSL-CM5A-LR -> high top models) • NCEP R1 analysis: 1958-2005 • Historical simulation analyses: 1950-2005 • AMIP simulation analysis: 1979-2008 • Daily average zonal-mean zonal winds are used to assess: • a) Structure and seasonal evolution of polar vortex (PV) • b) Interannual variability in polar vortex demise (SFW) • c) Organization of tropospheric winds by SFW events 3. Polar vortex structure (zonal wind field) NCEP/NCAR HadCM3 (hist-r1) HadCM3 (hist-r3) NCEP/NCAR HadCM3 (hist-r1) HadCM3 (hist-r3) • SFW onset determination insensitive to observational dataset • Weak trend toward later boreal SFW events between 1958-2011 • SFW events are delayed in all simulations except HadGEM2-CC • Interannual variability well represented in both high-top models Left: Zonal-mean zonal wind (m s-1) time averaged over the boreal cool season (Black & McDaniel 2009). Right: Daily values of 10 hPa zonal mean zonal wind averaged from 60- 80oN. Climatological seasonal cycle (purple) and SFW composite (blue) (Black et al. 2006). HadGEM2-A (amip) HadGEM2-CC (hist) IPSL-CM5A-LR (hist) HadGEM2-A (amip) HadGEM2-CC (hist) IPSL-CM5A-LR (hist) 6. Organizing the Tropospheric Circulation • Daily evolution of zonal-mean zonal wind averaged from 60-80oN Top Row: Climatological cycle centered on Mean Date (lag 0) Bottom Row: Composite SFW time evolution (lag 0 = SFW onset) • Boreal polar vortex too weak in HadCM3 simulations • Polar vortex too strong in HadGEM2-A (amip) & IPSL • HadGEM2-CC provides best structural representation Daily evolution of zonal-mean zonal wind (m s-1) averaged from 60-80oN Left: Climatological-mean evolution centered on April 14 (denoted lag 0) (Black et al. 2006). Right: Composite time evolution of SFW events (Black et al. 2006). 4. Seasonal Evolution of the Polar Vortex HadCM3 HadGEM2-A (amip) HadGEM2-CC IPSL-CM5A-LR • PV breakdown more abrupt in HadGEM2-A & IPSL-CM5A-LR • PV breakdown considerably more abrupt in SFW composites • Tropospheric tendencies focused at Day 0 in SFW composites • All models exhibit qualitative resemblance with observations • Boreal structural evolution poor in HadCM3 simulations • Polar vortex persists too long in HadGEM2-A & IPSL • Seasonal evolution well represented in HadGEM2-CC 7. Summary • 5. Stratospheric Final Warming Events • Defined as the last time the 50 hPa zonal-mean zonal wind at 70oN drops below zero without returning to the specified positive threshold value (5 ms-1) until the following autumn (following the methods of Black et al. 2006). The criterion is applied to running 5 day averages of zonal-mean wind. • SFW events provide an organizing influence on the troposphere • CMIP5 models are capable of representing this influence, but… • PV often too strong (cold pole) and SFW delayed vs observations • Greater interannual variability observed in high top models • HadGEM2-CC closely resembles observed PV/SFW behavior • Additional work required for comprehensive model assessment Acknowledgements: This research is jointly supported by the National Science Foundation under Grant ARC-1107384 and the Department of Energy under Grant DE-SC0004942. The NCEP-NCAR reanalyses come from the NOAA Climate Diagnostics Center from their web site at http://www.cdc.noaa.gov/