Download

1 / 19
190 likes | 315 Vues
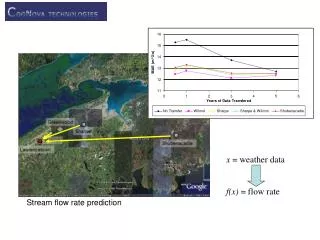
Stream response as the sum of flow component responses. Mike Stewart Aquifer Dynamics & GNS Science, NZ. m.stewart@gns.cri.nz. www.aquiferdynamics.com. This talk presents new approaches for both base flow separation and recession analysis. Baseflow separation.

E N D
Stream response as the sum of flow component responses Mike Stewart Aquifer Dynamics & GNS Science, NZ m.stewart@gns.cri.nz www.aquiferdynamics.com
This talk presents new approaches for bothbase flow separation andrecession analysis
Baseflow separation The new method is based on tracer (e.g. stable isotope or chloride) evidence showing fast base flow response to rainfall due to celerity (‘bump’) and slow recharge of aquifers during wet periods (‘rise’) Hence the name ‘bump and rise’ method or BRM
Optimisation process gives f and k Thesumof a fast recession and base flowis fitted to the streamflowby adjusting f and k
Glendhu GH1 Catchment: Tussock grassland Outlet stream Wetland
Example: Glendhu Catchment 1st stream (base flow) 2nd stream (quick flow) Together they produce streamflow
Example: Glendhu Catchment 1st stream (base flow) 2nd stream (quick flow) Together they produce streamflow
Recession analysis The new method consists of analysing separated quick flow and base flow components as well as streamflow The analysis is made by plotting discharge (Q) versus slope (dQ/dt) on log scales This is called a ‘recession plot’
Analysing recessions The power law expression is fitted to the points in the recession plot Different values of exponent d indicate different types of storage reservoirs (e.g. d = 1 shows linear storage, d = 1.5 non-linear quadratic, etc.)
Streamflow has slope ~ 4, quick flow has quadratic slope ~ 1.5 Catchment GH1
‘Master’ recession curve for GH1 Inflection point From Pearce et al., 1984
‘Master’ recession curve replotted Fitted by the sumof the base flowand fast recession Inflection point
Recession plot of ‘master’ recession curve This slope is meaningless
Conclusions A new evidence-based base flow separation method is presented Using this, it is contended that recession analysis should be applied to separated components (quick flow and base flow) rather than to streamflow alone, because the latter gives misleading results due to streamflow being a mixture of the two components
Conclusions (2) When this is done, quick flow and base flow are found to have slopes on recession plots of 1.5, indicating that water is stored in quadratic reservoirs for both
References Stewart M.K., 2013: New base flow separation and recession analysis methods for streamflow. Submitted to Water Resources Research, 11 Oct. 2013. Pearce, A. J., L. K. Rowe, and C. L. O’Loughlin1984: J.Hydrol. (NZ) 23, 60-72.