Download
1 / 53
530 likes | 601 Vues
Exploring Scientific Procedures. 2+2 = 5 Rule. People forget what you say, and they forget what you do. But they will never forget how you make them feel.

E N D
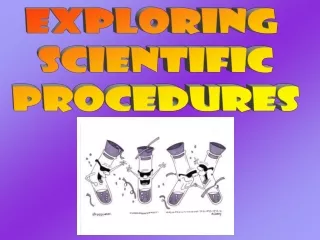
Exploring Scientific Procedures
2+2 = 5 Rule People forget what you say, and they forget what you do. But they will never forget how you make them feel.
Exploring Scientific Procedures (ESP) is a method of introducing the concepts of scientific inquiry to students and educators which includes : independent/dependent variables, hypothesis building, constructing data tables, procedural writing styles, and graphing. The materials necessary to perform this method are cheap and easy-to-find and use. Most materials can be found around the home. This PowerPoint presentation is intended to train you, the educator, on the basics of scientific inquiry. A rough timeline has been provided within this presentation to guide you through the potential administration of the method to students of various grades.
The proven success of this method has been accomplished through short, weekly activities with students over a long period of time. ESP should be presented to students much like multiplication facts: in repetitive short bites, spread out over an extended timeframe. Students will begin to see how the independent/dependent variables, hypothesis, data tables and graphs are all related to the process of effective scientific inquiry.
What ESP is...ESP is a method to integrate the process of scientific inquiry into your regular science curriculumESP encourages problem-solving strategies for students and adultsESP is low cost !!!ESP is a discipline that requires time and patienceESP should be used repetitively, in short amounts, over a long period of time (similar to learning multiplication tables!!!)
What ESP is not... ESP is not a script to be read ESP is not a curriculum to be memorized, but a method towards scientific literacy ESP does not have a standardized timeline ESP is not exclusively for students ESP is not a long list of definitions found within a massive textbook (two definitions are all you need…..)
DEFINITION #1 Independent Variable What you change in the experiment (to make life easier for your students, you may want this “change” to be measurable - i.e. weight, mass, volume, height, etc..)
DEFINITION #2 Dependent Variable The result from the change you made (this variable, also known as data, “depends” on your independent variable and, again, should be measurable !!!)
The INDEPENDENT VARIABLE and the DEPENDENT VARIABLE are close relatives and can be found throughout the following steps of scientific inquiry:QUESTIONSHYPOTHESISDATA TABLESand GRAPHS
All scientific experiments begin with simple questions…. It is this sense of inquiry that ESP begins its journey…. …with a QUESTION
Questions Does the_________________________ (Independent Variable) affect the________________________?(Dependent Variable)
Now that you’ve asked a QUESTION, it is time to change it into a measurable and educated guess…. … a HYPOTHESIS
Hypothesis • If the_____________is____________, • (Independent Variable)(increased/decreased) • then the____________will___________. • (Dependent Variable) (increase/decrease)
All data that is collected within an experiment must be in an easy format for future study. The following DATA TABLE should remain the same throughout each of your student’s experiments. With practice, they will become very proficient in recording data that can be easily analyzed.
Data Table Dependent Variable Independent Variable Trial One TrialTwo Trial Three Average
While analyzing the data in an experiment, you are typically looking for patterns and relationships between what you are changing (the INDEPENDENT VARIABLE) and your data (the DEPENDENT VARIABLE). A GRAPH can help visualize the data in a way that is easier to see any of these possible relationships.
Title Dependent Variable Independent Variable
The TITLE of any GRAPH should restate the HYPOTHESIS of the experiment…. ….this helps the person who is reading your graph to easily identify what the data is all about!!!
GRAPH TITLES The effect of the________________ (Independent Variable) on the_________________. (Dependent Variable)
Students must see the INDEPENDENT VARIABLE and the DEPENDENT VARIABLE in theQUESTIONSHYPOTHESISDATA TABLESand GRAPHS
Let’s try an example... Question: Does the amount of porridge in each cup affect the temperature of the porridge over a period of time?
Does the distance a rubber band is pulled back affect the distance a rubber band can travel? Can you identify the IV and DV? IV = amount of porridge in each cup DV = temperature of the porridge LOOK FOR THESE PHRASES THROUGHOUT THE EXAMPLE !!!
Hypothesis If the amount of porridge in each cup is increased, then the temperature of the porridge will decrease.
Data Table Amount of porridge in each cup (IV) Temperature of the porridge (DV) Trial One Trial Two Trial Three Average 10 ml 50 ml 100 ml
The effect of the amount of porridge in each cup on the temperature of the porridge Amount of porridge in each cup (ml) (DV) Temperature of the porridge (C) (IV)
The phrase “theamount of porridge in each cup” and “the temperature of the porridge” can be seen throughout the entire experiment!!!
YOU NEVER CHANGE THE PHRASES... THEREFORE, THE STUDENT WILL EASILY SEE THE RELATIONSHIPS BETWEEN THE QUESTION HYPOTHESIS DATA TABLE and GRAPH
With weekly repetition, students will be able to effectively set up, run and analyze the results of a scientific experiment!!!! More importantly, each experiment can be used to reinforce the scientific concept your student is currently learning. For example…..
If your students are learning about how energy can be transferred from one substance to another, you can use the Goldilocks experiment to reinforce this concept… …and while they are learning about the transfer of potential energy to kinetic energy, they are also practicing effective scientific inquiry procedures !!!
Once your students become more proficient at this model…. YOU CAN REALLY START HAVING FUN WITH THEM...
Have the students list: Materials used in experiment Cup, water, thermometer All of the possible ways the materials could have been changed (each of which is a “SOE”) Size, shape, color of the cup and/or thermometer, method of transferring the water, etc…
All materials in an experiment must remain CONSTANT The possible changes in materials identify sources of error (SOE) that could alter the results of an experiment Constants are very important because you only want to change ONE variable in your experiment!!!
Why do you only want to change ONE thing in your experiment? So that you can identify what variable is altering the results in your experiment….. ….if you changed two variables, how would you know which one is affecting the results???
CONSTANTS share their importance with another factor in experiments... The CONTROL The control is a trial within your experiment that is used to identify any unknown SOE’s that may be affecting your data For example...
If your student wishes to see the effects of salt water on the growth rate of plants, the CONTROL in this experiment would be to use ordinary water with their plants to gauge the normal growth rate. Along with this CONTROL, the student will grow other plants with varying levels of salt water...
If all the plants die, with the exception of the CONTROL, you may assume that the salt is the culprit!!! If even the CONTROL perishes, you may have an unknown SOE in the water that needs to be identified.
The CONTROL is the normal expectation of what is to happen. Typically, you tend to already know what to expect with your CONTROL, but you run the trials anyway…just to be certain there are no hidden SOE’s that could affect your results.
The Grade Level Expectations provide you, the educator, a rough timeline of what to expect from your students according to their grade level. Naturally, each student progresses at different levels. These Expectations may, of course, be modified to meet the individual needs of your learners.
QMS Strategy Question Method Solution
QMS Strategy Consider the QMS Strategy as the “challenge phase” of this method….. Up to this time, you have been providing your students with the Question to solve in their experiments Now, let’s change the procedure a bit….
Instead of providing the question to your students, now provide the Method (a procedure) or Results (a data table or graph) for them to follow…. - For example - By providing a completed graph to your students, or perhaps a procedure, your students can be asked to determine the experimental: Question Hypothesis Data Table conclusion
By providing a graph such as this, the Independent and Dependent Variables can be identified…… (DV) (IV)
…. and can be used to create a question and a hypothesis such as these: Question Does the time of day affect its temperature? Hypothesis If the time of day is increased, then the temperature will increase/decrease.