Download
1 / 49
490 likes | 692 Vues
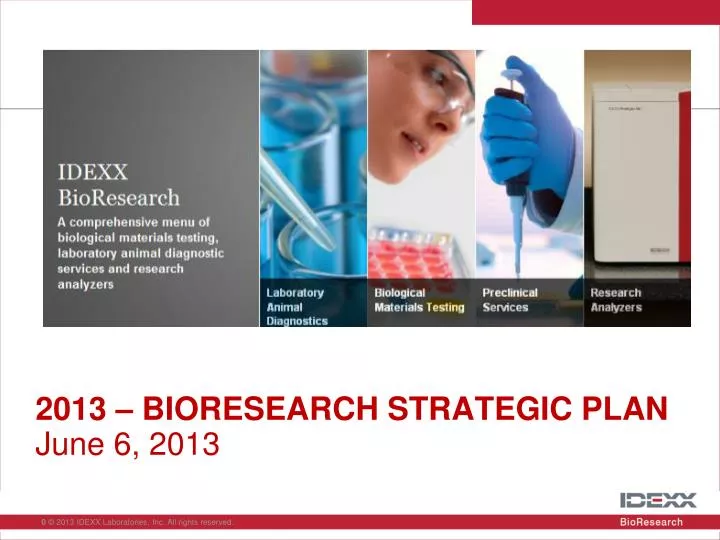
2013 – BIORESEARCH STRATEGIC PLAN June 6, 2013. Strategic Plan Executive Summary. Establishing the BioResearch brand Strategy assembled from strengths across the business Leveraging innovations, leadership in any one part of the business to drive a multiplier across the whole business

E N D
2013 – BIORESEARCH STRATEGIC PLAN • June 6, 2013
Strategic Plan Executive Summary • Establishing the BioResearch brand • Strategy assembled from strengths across the business • Leveraging innovations, leadership in any one part of the business to drive a multiplier across the whole business • Increasing sales efficacy – adding sales support and increasing focus on education • Setting a new baseline • Building better understanding of BRM customers’ needs and behaviors – for example, lower utilization, longer buy cycle for instruments than CAG • The 5-year growth profile has modestly declined, now reaching $65M in 2018 • 22.3% Revenue CAGR – 2013-2018 • Investing in sales – as a percent of revenue, sales expense increases from 14.2% in 2013, to maximum of 18.2% in 2015 before falling to 13.8% in 2018 • Through investment and partnership, driving to deliver innovation for our customers • Raising the bar in the industry through innovation in health monitoring and zebrafish • Meeting (then exceeding) the expectations of our customers by delivering best-in-class Information management & connectivity tools, finding a solution for in-lab chemistry and expanded offering to include GLP
Total BioResearch Key Assumptions in P&L • VetLab BRM lower baseline (2013: -$1M Rev, -$0.5M GM) due to lower than expected placements/install base. Baseline adjustment not submitted. • VL BRM consumable utilization increases over time as installed base expands to high volume / large CRO accounts • RADIL revenue from international clients previously recorded in USA P&L will be reflected in regional P&L’s (Singapore, Europe) in the strategic plan period • Price increase assumptions: 3% list price increase, 2% realized price increase • Labs same store volume growth = 1% • New product launches contributing to revenue growth: XTV, Zebrafish
BRM Positioning StatementWhat is our market story, and what makes us relevant and unique? IDEXX Bioresearch provides specialized diagnostic services and analyzers to support biomedical research organizations dedicated to the improvement of human and animal health. Unlike other specialized analytical and diagnostic services providers, IDEXX Bioresearch provides high level scientific and veterinary expertise that assists with data interpretation assuring researchers of thequality of animal health, the integrity of biological reagents, and the accuracy of diagnostic and preclinical testing.
Want to Bring Together Strengths of Three Businesses How can we improve our instrument sales pipeline? How do we do a better job of leveraging the RADIL business strengths, resources and customer relationships to drive higher pre-clinical and instrument sales; i.e., how do we make 1+1+1= 5? RADIL PRECLINICAL • Scientific expertise • Name recognition • Innovation • Business Processes • Academic client base • Customer service • RADIL LIMS • Optimal health monitoring IDEXX Bioresearch • Consultative expertise • Scientific knowledge and support • Cutting edge innovation • Broad portfolio and comprehensive test menus • Broad client base • Industry leading data management + • Broad test menu • Pathology expertise • RealTime PCR • Pharma/Biotech client base • GCP capabilities • Customer service • Courier system + Instruments • Hematology portfolio • Sysmex partnership • Service & Support infrastructure (FTS, SmartService, etc.)
Sales Team Feedback: CompetitivenessWhat customer segmentation best describes the opportunity for pre-clinical and instrument sales – customers for which we can provide an end-to-end solution and those which benefit primarily from pre-clinical services or instruments? ProCyte a very good solution XTV less competitive for price Chemistry, other instruments a tactical gap Catalyst Dx validation, sample size, menu issues Price, research menu,GLP and IT connectivity are gaps In-house competition In-house competition Bid process Not always applicable Awareness of offering lacking in market = Competitive= Not competitive
Sales Team Needs More Support, More BioResearch Experience.Do we have the right resource mix (sales) and allocation of time spent on selling our product offerings (RADIL, Preclinical, Instruments). Inside sales Linda Brokamp Robin Myles BioResearch Market Experience Jim Grossman + 2 Field Sales headcount during 2013 Biologicals (+1 HC) Account Management Kristi Garner Jeff Burkett Sharon Byras Big Ticket Sales ? Andy Jaap Study manager/coordinator (+1 HC) Quote prep PreClin support Lead screening Study ombudsman Chris Pendleton IDEXX Experience Yellow = investment Establishing metrics, tracking tools to gauge effectiveness
Three Pillars of New Product Commercialization Efforts What is the commercial strategy for leveraging our new products in 2013? Offering portfolio of best-in-class lab instrumentation Establishing ‘door-opener’ and ‘foundation’ with Zebrafish Establishing IDEXX as the optimal analytical and diagnostics company Comparable (cross platform), best-in-class results, regardless of laboratory throughput needs Unprecedented flexibility for studies where hematology is routine Advanced features, including manual gating, available on both platforms Establishes IDEXX as the leader in lab hematology – with multiplier for other businesses Identify solution for in-clinic chemistry IDEXX is the commercial leader in the nascent zebrafish diagnostics and health monitoring Establishing IDEXX as the expert in zebrafish diagnostics IDEXX research and education programs are opening doors and building awareness across product lines Establishing collaborations with government-sponsored zebrafish resources Opportunity for IDEXX to take first-mover advantage? • Innovation keeps IDEXX at the forefront of technology and drives customer allegiance – multiplier drives awareness across IDEXX’s product lines • Reinforce IDEXX’s leading position in the market via research and scientific presentations • Opti Q/Opti HM – launched • Dry blood spot (June) • MFI IA bead sales (July) • Stat PCR (August) • Fecology (October) • Stat micro (Q4) • Biomarkers beyond 2013(e.g., SDMA, nt-proBNP) Fourth pillar beyond 2013: GLP facility drives a multiplier in preclinical business
Zebrafish (Zf): Opportunity To Be Scoped and Sized Today: Near-term: The Vision: • Recent launch of Zf diagnostics • Suite of diagnostic offerings that provides the basis for Zf health monitoring • Client consultations provided by Zf expert • Ongoing R&D aimed at gaining a better understanding of Zf diseases and improving health monitoring • Expanded range of services for clients • New revenues from Zf testing • Opens doors to competitive take-away accounts for diagnostics, preclinical, and analyzer business IDEXX Bioresearch has an international reputation as the One-Stop-Shop for Zf needs. Known as: • The Lab for Zf health monitoring • The Experts on Zf diseases and Dx • The Source for Certified Zebrafish (CZf) • Zf with certified health and genetic status • Zf food • Zf informatics
Four Tenets of Information Technology Strategy Vision: Provide connectivity between IDEXX and customers’ data management systems LDE (LabsDataExchange) ProCyte Dx workcell IV. Enable import of Charles River data into LDE to facilitatecustomer conversion VetLab Suite SYSMEX XT-V Customer’s LIS Research Connect/RADIL Online RADIL LIMS Preclinical I. Standardize analyzercommunication protocols (LIS ASTM 1394) to push data to customer LIS, BRM’s LDE(Data Acquisition Server) III. Enable querying of labs and analyzer data through customers’ LIS or RADIL ONLINE II. Connect RADIL LIMS, preclinical information intoLabs Data Exchange Focused on goals of integration – not specifics of solution architecture
BRM International Strategy • International strategy: Do we have the right resources / product offerings in place internationally to drive the business both in the short term and long term? Working: Near-term: Needs: • Commercial Team is now in place UK and Germany • New hire expertise in: • Hematology (ex-Sysmex) • Health Monitoring(Ex-CRL) • Expand commercial • Nordic • France • Opportunistic approach in APO • Brand recognition • Lead generation • EU Specific: • Price List • Web site • Lab Capacity in EU • Pre-Clinical Expertise • Quote and Deliver • GLP capability
Revenue by Region 2013 – 2018 (1) Reflects 2013 baseline adjustment
CONFIDENTIAL IDEXX Laboratories, Inc. 2013 Strategic Planning Process BioResearch Market Finance Slides June 6, 2013
Total BRM Strategic Plan Comparison – 2013 vs. 2012 (USD in thousands) Variance to PY strategic plan driven mainly by VetLab BRM instruments and consumables
Total BioResearch Revenue Profile 2008 – 2018 Total BioResearch Revenue 2008 – 2018 Drivers of Revenue Growth • Total BRM • Growth slightly below prior year strategic plan, adjusted for lower baseline • Note: baseline adjustment of $(1.024M) not submitted • VetLab BRM • Lower install base driven by: • Slower ramp in sales force FTE’s • Fewer assumed units per rep • Delay in final XTV contract in N. America • Decreased consumable sales driven by: • Lower overall instrument install base • Decreased utilization assumptions • Labs BRM • Revenue shift between Americas and Europe • Americas revenue down versus prior strategic plan primarily related to lower PreClinical revenue base due to major study ending in 2012 (~$1.3M/yr impact on strategic plan period) Revenue (USD in millions) Actual SP 2013 SP 2012
Total BRM Gross Margin Profile 2008 – 2018 Total BRM Gross Margin (as % of Revenue) Drivers of Change in Gross Margin • Total BRM • 2014 gross margin decline due to 2013 baseline. • If submitted, GM baseline adjustment of $(568k) would lower 2013 GM to 48.8%, in line with 2014 GM %. • 3% gross margin improvement from 2013-2018 driven by strong revenue growth in the labs and increased revenue from VetLab consumables • Gross margin improvement in 2012-2016 versus prior strategic plan driven by revenue mix, as revenue from labs makes up a larger portion of total revenue (labs margin higher than VetLab due to VL early years being mostly lower margin instrument revenue) • VetLab BRM • 11.7% gross margin improvement from 2013-2018 • Growing instrument install base drives revenue mix to shift from VetLab instruments to high margin consumables, consistent with prior plan • Labs BRM • Gross margin flat throughout strategic plan period, in line with prior year strategic plan % of Revenue Actual SP 2013 SP 2012
Total BioResearch Revenue 2013 – 2018 Labs BRM continues to be main driver of revenue growth, while shift to higher margin consumables drives margin improvement in out-years. (1) Reflects 2013 baseline adjustment
Total BRM Operating Expense Profile 2008 – 2018 Total BRM Op Expenses (as % of Revenue) Drivers of Change in Operating Expense Profile • Operating expense as % of revenue drops from 35.2% in 2013 to 28.2% in 2018. • Profile consistent with prior strategic plan. Minimal leverage in operating expenses to offset lower overall revenue. • R&D investments in 2013/2014 drive increase in total R&D expense, costs remain flat in out years • 2013: real-time PCR (RADIL) • 2014: XN, middleware projects • Sales expense as a % of revenue increases from 2013 to 2015 with expansion of sales force (14.2% to 18.2%), then declines to 13.8% as FTE base levels off and sales reps become more effective % of Revenue Actual SP 2013 SP 2012
Total BRM Operating Margin Profile 2008 – 2018 Drivers of Change in Operating Margin Total BRM Op Margin (as % of Revenue) • Operating margin increases from 14% in 2013 to 24% in 2018, with a CAGR of 36%. • Operating margin down versus prior strategic plan resulting primarily from revenue shortfall, mainly VetLab consumables. Overall mix shift lowers operating margin as high margin consumables contribute a lower percent of total revenue. • Minimal leverage in operating expenses to offset lower overall revenue % of Revenue Actual SP 2013 SP 2012
Total BioResearch Strategic Plan P&L - Expanded (USD in thousands)
Qualitative Assessment of Risks and Opportunities • Developing or acquiring GLP capabilities creates opportunity to expand our Pre-clinical business and attract major customers. • Europe revenue growth in 2014 and beyond is aggressive, with 40% CAGR 2013-2018. Mostly driven by lab expansion and FTE productivity assumptions. • Americas 2013 instrument placement goal is aggressive given potential changes to sales force and delay in getting to FTE goal for 2013. Lower 2014 beginning install base will challenge the consumable revenue throughout the strategic plan period.
Labs BioResearch Market APPENDIX A: Labs
Labs BioResearch Strategic Plan P&L Gross Margin remains consistent throughout strategic plan period.
Labs BioResearch – Strategic Plan Comparison – 2013 vs. 2012 (USD in thousands) Revenue shift between Americas (-) and Europe (+). Americas change driven by lower PreClinical revenue profile - loss of large client due to ended study resulted in lower 2012/2013 base revenue (impact = ~$1.3M/yr 2013-2018).
Labs BioResearch Strategic Plan P&L - Expanded (USD in thousands)
Labs BioResearch Strategic Plan P&L – Revenue and Operating Profit by Region (USD in thousands) 1) Operating profit reflects certain costs not specifically allocated to regions such as R&D and manufacturing variances.
Labs BioResearch Revenue Detail Worldwide 2013 = Q1 Act, Q2-Q4 Fcst 2013 YOY growth adjusted for loss of Catalyst Bio is 24.5% per March forecast 2014 YOY growth low as regional revenue is split out of Americas region. Adjusted YOY growth is 11%.
RADIL Revenue Growth 2013 to 2014 – NA North America 6% Growth 11% Adj. growth In 2013 RADIL revenue forecast in Americas is $13,158, of which $571 relates to revenue for testing done at RADIL submitted from Europe and APO regions. In the June forecast, this revenue will be reassigned to the appropriate regions. North America YOY revenue growth is 6%. North America YOY revenue growth adjusted for international revenue which will be reclassed to other regions in June forecast is 11%.
RADIL Compare to Acquisition Model - NA 2014 revenue projections lowered versus original acquisition model, but COS and OPEX savings result in improved operating margin. Revenue projected to grow at a faster rate through the strategic plan period versus the original model.
VetLab BioResearch Market APPENDIX B: VetLab
VetLab BioResearch Strategic Plan P&L Gross Margin increase due to instrument/consumable mix
VetLab BioResearch – Strategic Plan Comparison – 2013 vs. 2012 (USD in thousands) Revenue shortfall driven by lower instruments , lower beginning install base, and lower utilization assumptions
VetLab BioResearch Strategic Plan P&L - Expanded (USD in thousands)
VetLab BioResearch Strategic Plan P&L – Revenue and Operating Profit by Region (USD in thousands) 1) Operating profit reflects certain costs not specifically allocated to regions such as R&D and manufacturing variances.
VetLab BioResearch Revenue Mix Revenue shift from instruments to consumables results in increasing gross margin throughout the strat plan period
Instrument Placements per Sales Rep 2013 units assumed more FTE’s No change in # units from 2013 to 2014 – assumption is 2013 unit goal is aggressive given probable changes with the sales force and time to train new reps
VetLab BioResearch Utilization Assumptions North America Utilization increases as PDx and CDx placements expand to high volume / large CRO accounts VetLab BioResearch Install Base Worldwide
Total BioResearch Market – Regional P&L’s APPENDIX C: Regional
Total BRM P&L – Revenue and Operating Profit by Region (USD in thousands) 1) Operating profit reflects certain costs not specifically allocated to regions such as R&D and manufacturing variances.
Total BioResearch Strategic Plan P&L – N. America (USD in thousands)
Labs BioResearch Strategic Plan P&L – N. America (USD in thousands)
VetLab BioResearch Strategic Plan P&L – N.A. (USD in thousands)
Total BioResearch Strategic Plan P&L - Europe (USD in thousands)
Total BioResearch Strategic Plan P&L - APO (USD in thousands)