Download
1 / 13
130 likes | 288 Vues
Experiments with Plants. Mr. Huttle’s Class Brown group Sarah ,Camilla , mason , T akuto . Wisconsin Fast Plants. Conclusion. Graph of Plant Growth Control. Graph of Plant Growth Test. Variables we tested ( Manipulated ). Sketch of flowering Plant. Sketch of fertilized Plant.

E N D
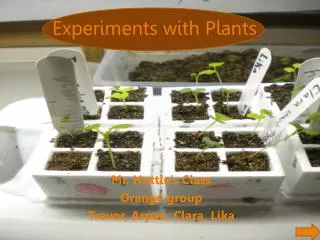
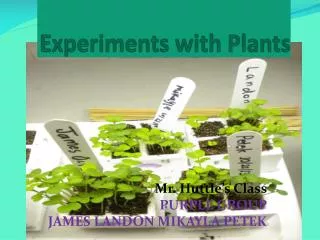
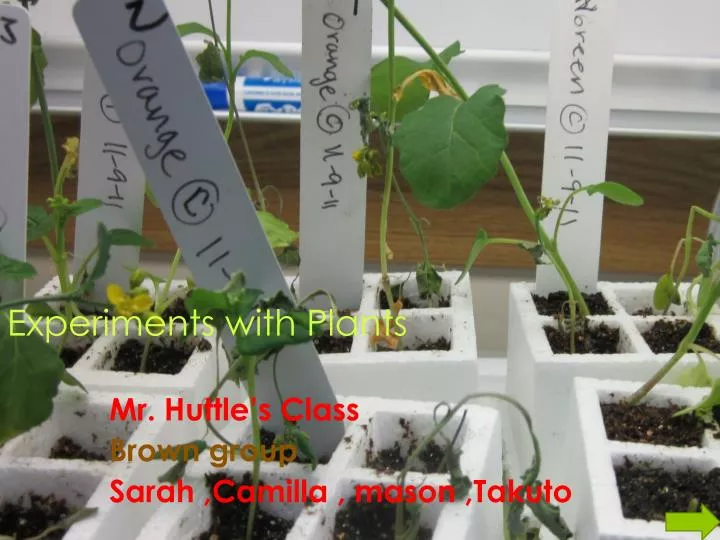
Experiments with Plants Mr. Huttle’s Class Brown group Sarah ,Camilla , mason ,Takuto
Wisconsin Fast Plants Conclusion GraphofPlantGrowth Control GraphofPlantGrowth Test Variableswe tested (Manipulated) SketchoffloweringPlant SketchoffertilizedPlant Variables NotChanged(Controlled) Sketchofworkerbee Illustrationofinterdependencebetweenflowering plants andbees Howwetestedthevariable(Responding)
History of the Wisconsin fast plants Dr. Williams is the man who created these fast plants to grow fast. Roots, they help the plant give structure support to the plant so it’s unlikely for it to fall over, roots also take in water (in the water there are nutrients). Next there is the stem it carries H20 and sugar to the leaves and to the flowers so that the plant can reproduce and create energy. Leaf, this is where the plant turns sun energy into chemical energy in a process called photosynthesis. The flower, the reproductive part of the plant produces pollen and seeds. The Wisconsin fast plants have adaptations to attract specific pollinators. For example, white flowers attract hummingbirds. Did you know that it took Dr. Williams15 years to create the Wisconsin fast plant? He studied and studied and saw how his fast plants worked. Dr. Williams is a pathologist. His job was to study plant diseases. That was the history of the Wisconsin fast Plants. History of the Wisconsin Fast Plant
Variable we tested (Manipulated) The variable we tested was fertilizer. We thought that the plant would die because the Wisconsin fast plant is a vascular plant. Vascular is tubes that carry food and water throughout the plant. We thought that the test plants would die because we thought there would be too many nutrients to carry in the tubes to get to the flower. The tubes also might get clogged and heavy weighted. They might even fall down and damage the whole system. All tubes need to be in control in order to get the nutrients to the flower . It’s like a machine if one part fails, you can’t continuo to get what you want accomplish.
We didn’t changed specific variables water, temperature, light, and pollination. We didn’t change these variables because we wanted to have a fair test, and get a good growing plant. For these specific plants, if you change two or more variables you would get a dead plant. For example, if you gave one plant more water than another plant, that would not be a fair test. We were instructed to create a fair test, so in this case we kept the necessary variables that the Wisconsin Fast Plant needed to grow best. Variables Not Changed (Controlled) Variables not changed Water Light Temperature Space Pollination
Instead of putting 3 pellets of fertilizer into each pod, we put 8 in the experimental pods. Another reason why the plants might die is that Dr. Williams who created these plants said that there should only be 3 pellets in each pod. Putting 8 pellets is a big deal. Water gives the plant energy, 70 to 80 degrees is its temperature, and fertilizer pellets give the plant nutrients. Not too much not too little, we went beyond normal. How we tested the variable (Responding)
Graph of Plant Growth: Test Plants This graph shown here shows how the test plants grew. As shown here, cell3’s plant didn’t grow much But cell4’s plant grew tall. As a result, cell3’s plant grew a total of about 1 centimeter, and cell4’s plant grew a total of about 11 centimeters. We observed that takutoes plant failed because when we took all the soil and fertilizer out of the cell, we discovered that one of takutoes fertilizer pellets were ripped apart. I also think that the plant didn’t have enough water supply, or that I planted the seed too deep. Cell4 was a real success because no fertilizer pellets were damaged, the plant had enough water supply, and the seed was not as deep in the soil.
As you can see here on the graph, you see blue~cell1 and green~cell2. through the 9 days, the cell1 plant grew 10.2 centimeter and cell 2 grew 10.1 centimeters during the 9 days. During day one cell1 grew 8mm and during day 9(last day) the plant grew 11cm. In cell2 the plant started with 1.2 cm and on day 9 the plants grew 10cm. My group and I noticed that cell 1 started shorter than the cell2 but later on ,maybe on day 5, cell 1 grew about 1cm taller than the cell2 and later on cell 1 grew3cm taller than cell2. Graph of Plant Growth: Control Plants
Sketch of flowering Plant The male part of the flower is the stamen. The stamen contains the anther and the filament. The female part of the flower is called the pistil. It contains the stigma , ovule and the style. Pollen is brushed on the stigma and the pollen is delivered to the ovule. When the pollen is delivered the ovule, it produces eggs that are released into the earth
Sketch of fertilized Plant This sketch shows the entire Wisconsin fast plant. The plant is made out of multiple structures. First, we come to the roots. The water in the soil will be sucked up by the roots. The water travels inside the stem and into the leaves. Later, when flowers bloom, we pollinate the plant with bees. If we don’t pollinate, the plant won’t reproduce. Finally pods start to form. There are small seeds in the pods. The plant dies, and the pods are harvested. Then, it’s the beginning of a new plant generation!
Sketch of worker bee All worker bees are females. If you don’t know this already queen bees are different from worker bees. Worker bees is the 90% of the population in the hive. Worker bees has three body parts ,the head ,the thorax, and the abdomen. Worker bees have 3 jobs they are to clean the hive , to guard the hive. Another one is to make wax. Worker bees pollinate by collecting nectar at the same time they pick up pollen in their fur. They go to many flowers and the pollen on the worker bees fur ,rubs on the stigma of the flower and that fertilizes the plant so the plant grows seeds This is called interdependence between flowers and bees.
Bees go flower to flower to collect pollen and nectar. They collect pollen their hind legs. Then they go around to others flowers and some brushes off and lands on the anther. The anther delivers the pollen to the stigma. Then the stigma delivers the pollen to the ovule, that produces the eggs. Pollen is a sperm for the ovule. Finally the flower releases the eggs and the bees get nectar. Illustration of interdependence between flowering plants and bees
Conclusion All of our group plants that had more fertilizer pellet everything about them were bigger. Mason’s plants grow about 16 cm. and the controlled about grow 13.5 cm. Sarah’s plant grow about 14 cm. her controlled grow about 8 cm. Takuto’s grow about 12 cm. his controlled grow about 8 cm. Camilla’s plant grow about 10 cm. her controlled grow about 6 cm. all our plants leaves grow big we all had a lot more Our group compared the control and test plants and found that the control plant was growing like normal, but the test variable (fertilizer) affected the test plant’s growth. We put 8 fertilizer pellets in the test plant’s cells. The over fertilization gave the plant more nutrients than normal. The control plants were much different. On the control plants, we didn’t change any variables. We inserted 3 fertilizer pellets, which is the average number of fertilizer pellets in each plant. Our group thought that the number of pellets would affect the day the tested plants would die. on day nine the control plants died when it was only 9cms and the test plants died when it was 13cm. Plus, the test plants grew taller than the control plants. We learned that the more fertilizer pellets the taller the plant gets.